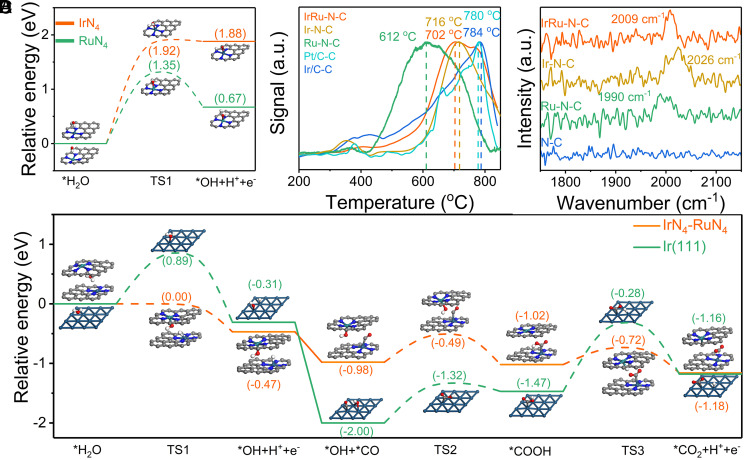
Fig. 4.
COOR reaction paths and CO adsorption status on the catalysts. (A) Energy profiles for H2O dissociation on IrN4 and RuN4 surfaces. (B) CO-TPD for the as-prepared catalysts. (C) CO-DRIFT for the as-prepared catalysts. (D) Energy profiles for the entire CO oxidation process on IrN4-RuN4 and Ir(111) catalysts. The x axis shows the reaction intermediates and transition states (TSs); the y axis shows the relative energy of each state. Ir, Ru, N, C, O, and H atoms are shown in olive, dark green, blue, gray, red, and white, respectively.

