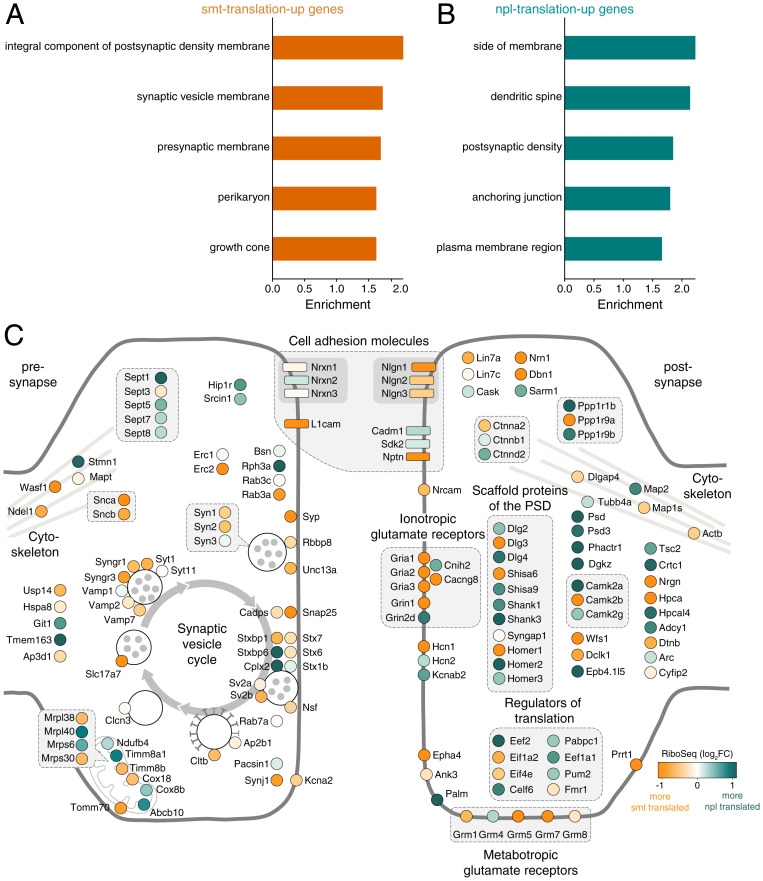
Fig. 2.
Functional segregation of transcripts differentially translated between the somata and neuropil. (A and B) GO terms representing the top five highest significantly enriched (FDR < 0.05) protein function groups for somata-translation-up (A) and neuropil-translation-up (B) transcripts. (C) Scheme depicting proteins of glutamatergic synapses. Ribo-seq neuropil:somata ratios (log2FC) are color coded from orange (more somata-translated) to teal (more neuropil-translated). Interacting proteins are displayed in closer proximity. Proteins with similar functions are grouped together and the synaptic vesicle cycle is indicated by arrows.

