Fig. 5.
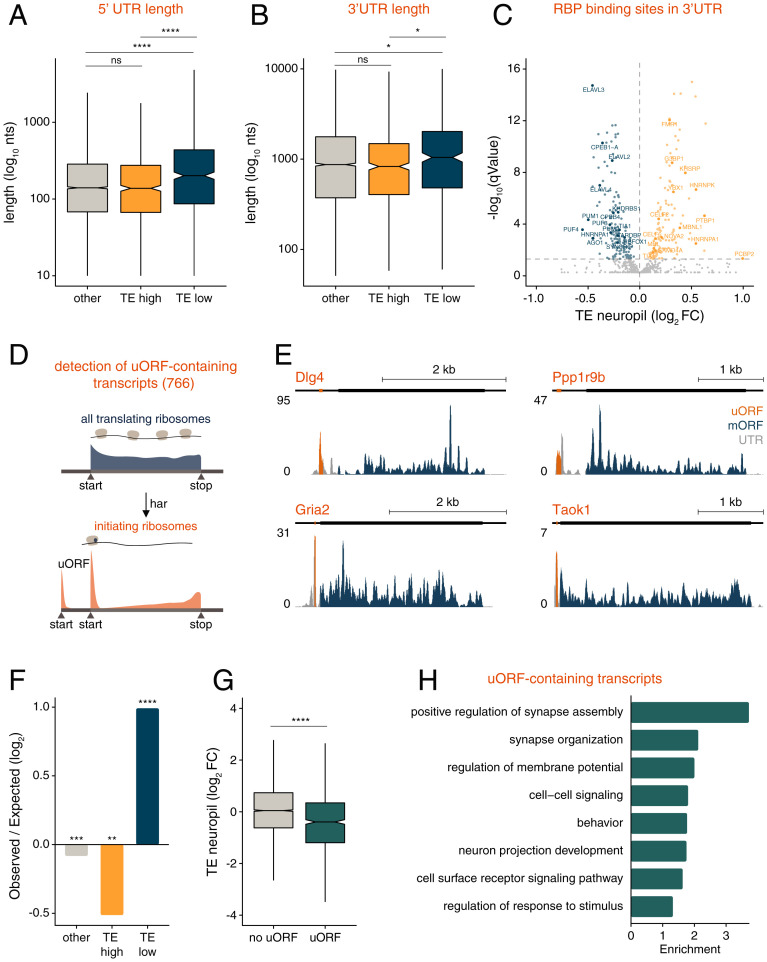
Features of translationally regulated transcripts in the somata and neuropil. (A and B) Box plots of 5′ UTR (A) and 3′ UTR (B) length (log10 nucleotides (nts) for TEhigh (yellow), TElow (blue), and other (gray) genes. Bars indicate 1.5*IQR. *P < 0.05, ****P < 0.0001; one-way ANOVA test followed by pairwise t test with Benjamini–Hochberg P value adjustment. (C) Shown are RBP motifs within 3′ UTRs associated with significantly lower (blue) or higher (yellow) neuropil TE values (q values < 0.05; Wilcoxon rank sum test) (Experimental Procedures). (D) Detection of translated uORFs in hippocampal neurons. Translation initiation sites were mapped using the drug harringtonine (har), which accumulates ribosomes at start codons. A total of 766 uORF-containing neuronal transcripts were detected in the somata and neuropil. (E) Coverage tracks representing the average ribosome footprint reads along the UTRs (gray), detected uORFs (orange), or the main protein coding sequence (blue) of Dlg4, Gria2, Taok1, and Ppp1r9b in the neuropil. The y axis indicates reads per million (RPM). (F) Observed-to-expected ratio of TEhigh (teal), TElow (blue), and other (gray) transcripts containing uORFs. **P < 0.01, ***P < 0.001, ****P < 0.0001; hypergeometric test. (G) Neuropil TE (log2FC) measurements of transcripts containing translated uORFs (“uORF”) or not (“no uORF”). ****P < 0.0001; Welch two-sample t test. (H) GO terms representing the top eight significantly (FDR < 0.05) enriched protein function groups for uORF-containing transcripts in the neuropil.

