Fig. 1.

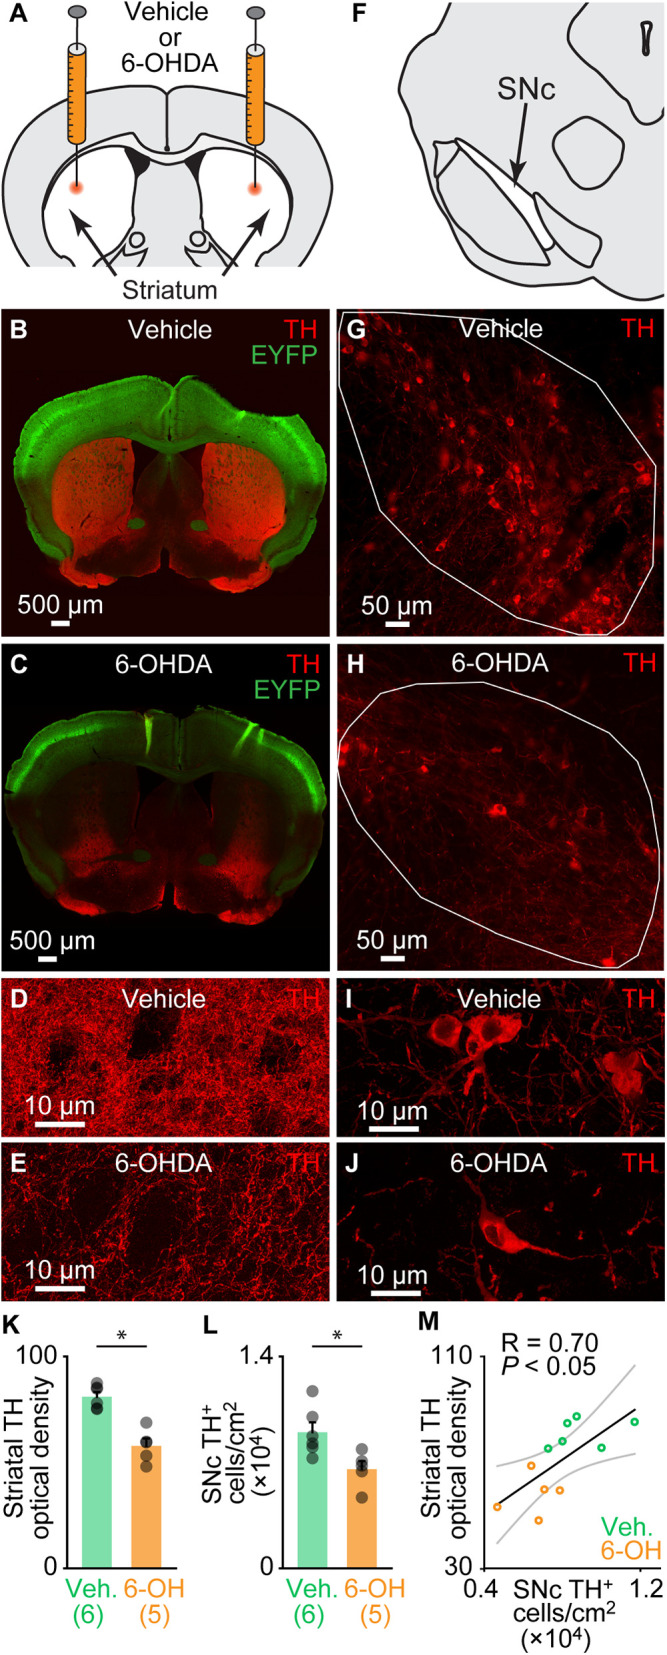
Bilateral striatal injection of 6-OHDA disrupts the nigrostriatal pathway. (A) Schematic illustration of the injection of 6-OHDA in the striatum (5 mg/mL, 1 μL per side; see Materials and Methods). (B and C) Comparison of striatal innervation by TH-positive fibers in a Vglut2-ChR2-EYFP mouse 3 d after bilateral striatal injections of vehicle (see Materials and Methods) (B) and in another one 3 d after bilateral striatal 6-OHDA injections (C). (D and E) Magnification showing TH immunofluorescence in the striatum of an animal injected with vehicle (D) or with 6-OHDA (E). (F) Schematic illustration of the location of TH-positive neurons in the SNc. (G and H) Comparison of the presence of the TH-positive cells in the SNc (delineated by the solid white lines), in a mouse injected in the striatum with vehicle (G) and another injected with 6-OHDA (H). (I and J) Magnification showing TH immunofluorescence in the SNc of an animal injected with vehicle (I) or with 6-OHDA (J). (K) Bar chart illustrating the optical density of TH immunofluorescence in the striatum of mice injected with vehicle (Veh) versus mice injected with 6-OHDA (6-OH). The number of animals used is indicated between brackets. *P < 0.05, t test. (L) Bar chart illustrating the average bilateral number of TH-positive cells per surface unit in the SNc (two slices counted per mouse; see Materials and Methods). *P < 0.05, t test. (M) Relationship between the number of TH-positive cells per surface unit and the striatal TH optical density in the pooled dataset (n = 11, including six mice injected with vehicle, green circles, and five injected with 6-OHDA, orange circles). *P < 0.05, linear fit. The coefficient of correlation (R), its significance (P), and the CIs (gray) are illustrated.
