Fig. 5.

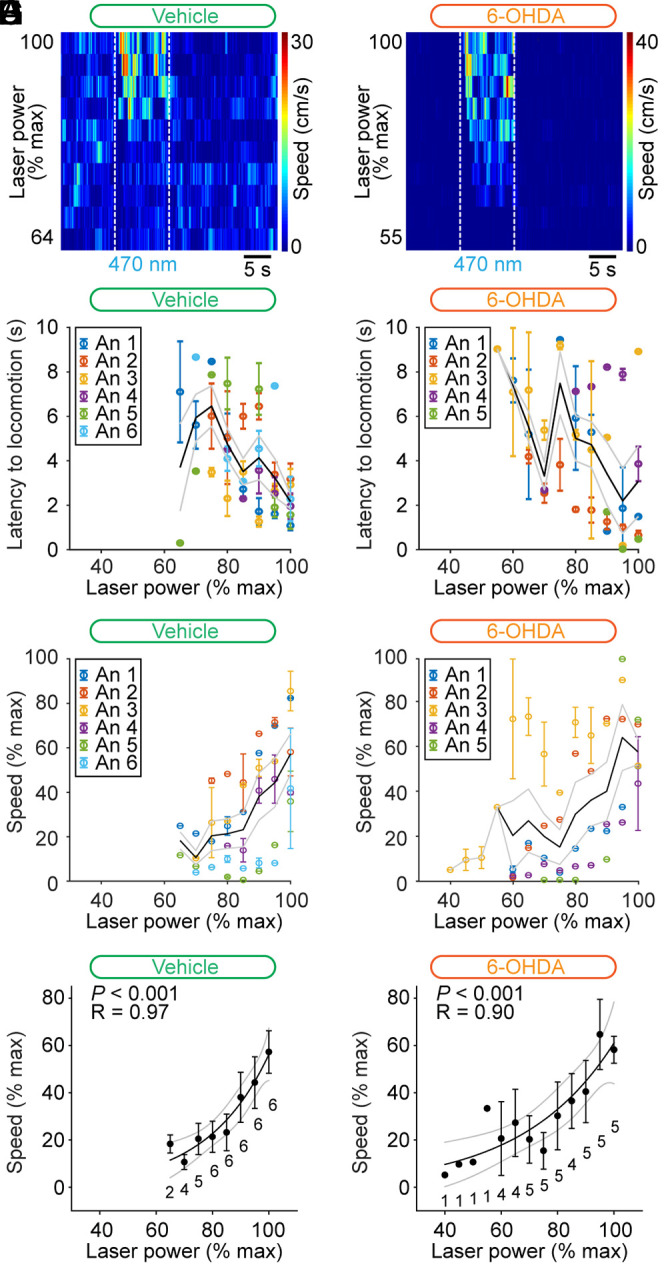
Control of speed by glutamatergic neurons of the CnF in Vglut2-ChR2-EYFP mice lesioned with 6-OHDA. (A and B) Color plots illustrating increases in locomotor speed in the open-field arena during optogenetic stimulation of the CnF in an animal injected in the striatum with vehicle (A) (3.2 to 5.0% of laser power) or with 6-OHDA (B) (5.5 to 10.0% of laser power). (C and D) Latency to locomotor initiation as a function of laser power (vehicle: 3.2 to 15.5% of laser power and 6-OHDA: 4.5 to 20.0% of laser power). Each dot represents the latency (mean ± SEM) measured during one to three trials. Laser power was normalized as a function of its maximal value per animal (% max) with a bin size of 5%. The average latency (solid black line) and the SEM (gray solid lines) are illustrated. The data from each animal (An) are illustrated with a different color. (E and F) Locomotor speed (0.3 to 23.5 cm/s in E and 0.2 to 30.9 cm/s in F) as a function of laser power (vehicle: 3.2 to 15.5% of laser power and 6-OHDA: 3.8 to 20.0% of laser power). Each dot represents the speed (mean ± SEM) measured during one to three trials. Speed and laser power were normalized as a function of their % max with a bin size of 5%. The average speed (solid black line) and the SEM (gray solid lines) are illustrated. The data from each animal are illustrated with a different color. (G and H) Relationships between locomotor speed (mean ± SEM and bin width 5%) and laser power in the same animals shown in E and F. For each bin, the number of animals is indicated below the data point. The data followed a sigmoidal function, both in the six animals injected in the striatum with vehicle (G) (solid black line, R = 0.97, and P < 0.001) and in the five animals injected with 6-OHDA (H) (solid black line, R = 0.90, and P < 0.001). For each fit, the coefficient of correlation (R), its significance (P), and the CIs (gray) are illustrated.
