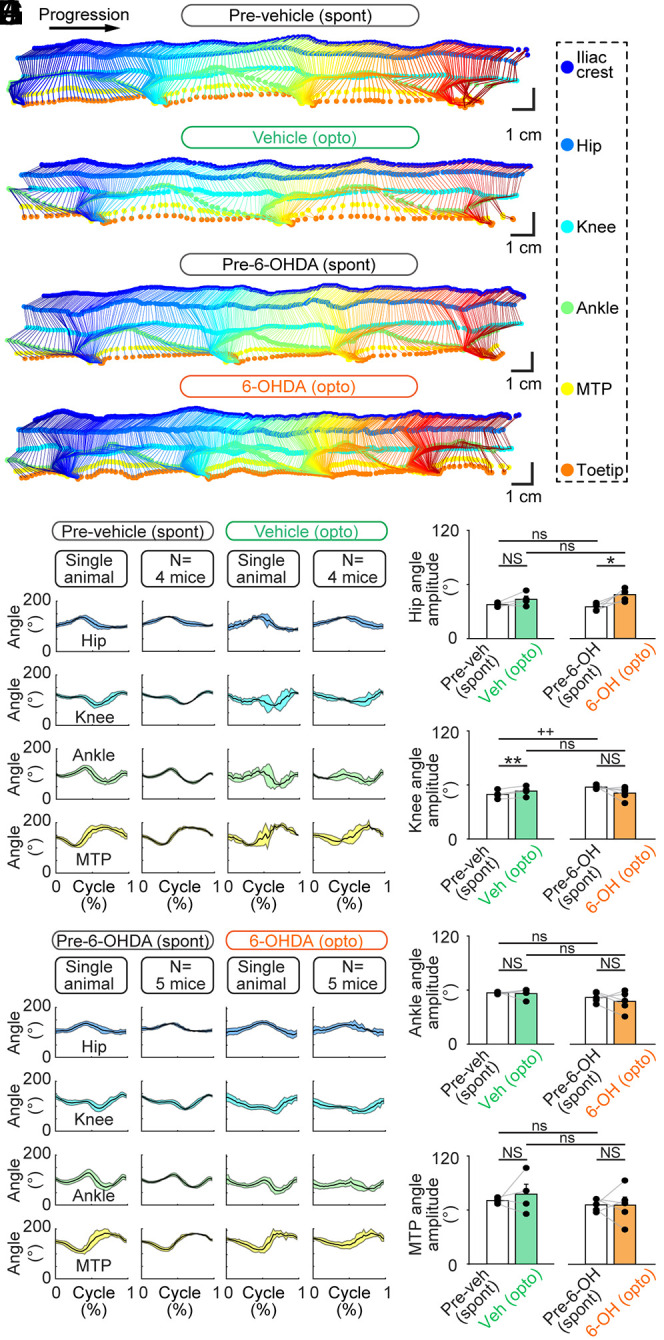
Fig. 6.

Hindlimb kinematics evoked by optogenetic stimulation of the CnF in Vglut2-ChR2-EYFP mice lesioned with 6-OHDA. (A–D) The movements of six hindlimb joints were tracked from the side at 300 fps in a linear corridor during spontaneous locomotion (spont) before the striatal injection of vehicle (A) or 6-OHDA (C), and during optogenetic-evoked locomotion (opto) after vehicle injection (B) (6.4% of laser power) or 6-OHDA (D) (30% of laser power). (E and F) The joint angles at the hip, knee, ankle, and MTP joint levels were calculated frame by frame. The cycle was defined as the time duration between two consecutive touchdowns of the MTP. A speed threshold of 9 cm/s was used to define the transitions between swing and stance phases. For single-animal data, joint angles (mean ± SD) were plotted for a normalized locomotor cycle during spontaneous locomotion before vehicle (E) (31 steps) or before 6-OHDA injection (F) (30 steps) and during optogenetic-evoked locomotion after striatal vehicle injection (E) (8 steps and 6.4% of laser power) or after striatal 6-OHDA injection (F) (32 steps and 10% of laser power). For the pooled data, joint angles (mean ± SD) were plotted for a normalized locomotor cycle during spontaneous locomotion before vehicle injection (E) (31 to 39 steps per animal) or before 6-OHDA injection (F) (28 to 34 steps per animal) and during optogenetic-evoked locomotion after vehicle injection (E) (3 to 19 steps per animal and 5.2 to 20.0% of laser power) and during optogenetic-evoked locomotion after 6-OHDA injection (F) (3 to 32 steps per animal and 5 to 30% of laser power). (G–J) Comparison of the amplitude of the hip (G), knee (H), ankle (I), and MTP (J) angles during spontaneous locomotion before vehicle (Veh) or 6-OHDA (6-OH) injection and during optogenetic-evoked locomotion after vehicle or 6-OHDA injection (vehicle, n = 6 mice and 6-OHDA, n = 5 mice). NS: not significant, P > 0.05, *P < 0.05, **P < 0.01, paired t tests; ns: not significant, P > 0.05, ++P < 0.01, t test, or Mann–Whitney rank sum test.
