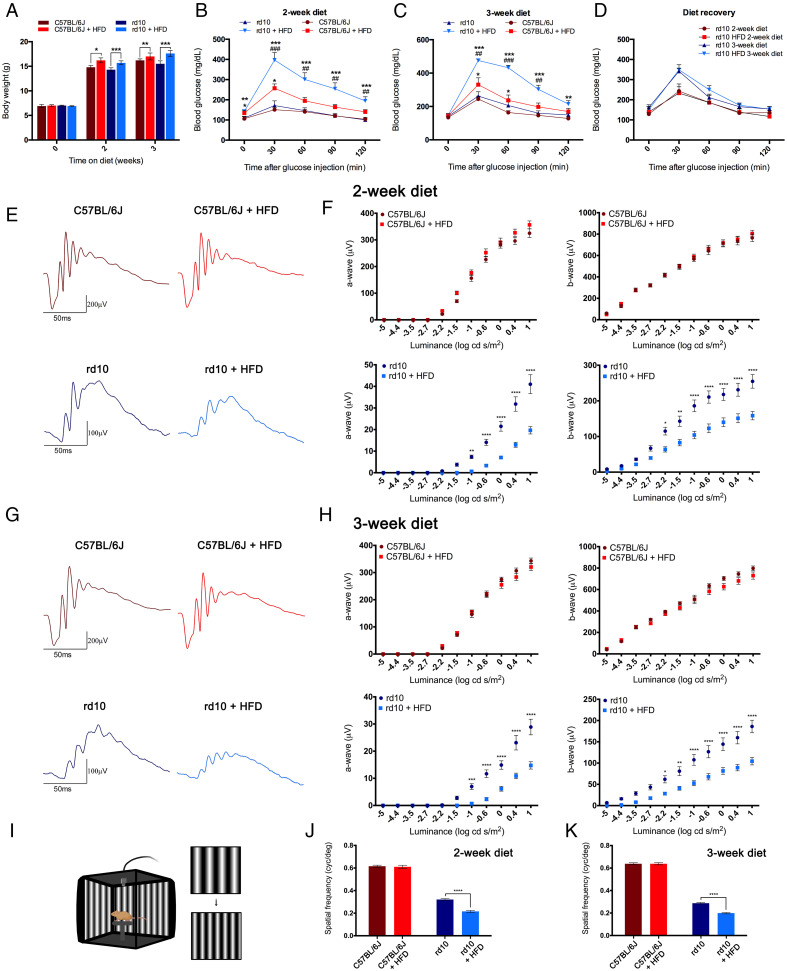
Fig. 1.
Metabolic parameters and retinal function are affected by high-fat feeding. (A) Body weight in control C57BL/6J and dystrophic rd10 mice after 0, 2, or 3 wk of normal or HFD from postnatal day 19 (n = 7 to 55). (B and C) Plasma glucose concentrations 0, 30, 60, 90, and 120 min after intraperitoneal injection of glucose (2 g/kg body weight) in fasted C57BL/6J and rd10 mice following 2 (B) or 3 (C) wk of dietary treatment (n = 7 to 15). (D) Glucose tolerance tests in rd10 mice 2 wk after the end of a dietary treatment of 2 or 3 wk (n = 4 in all cases). (E–H) Representative scotopic ERG responses to 1 log cd s/m2 flashes (E and G) and luminance-response curves for the a- and b-waves (F and H) from C57BL/6J and rd10 mice fed a normal or HFD for 2 (E and F) or 3 (G and H) wk (n = 6 to 18). (I) Illustration of the optomotor apparatus used in this study (image created using BioRender; https://biorender.com/). (J and K) Visual acuity measured as the spatial frequency threshold in C57BL/6J and rd10 mice fed a normal or HFD for 2 (J) or 3 (K) wk (n = 3 to 11). ANOVA, Bonferroni’s test, diet effects (normal versus HFD), *P < 0.05, **P < 0.01, ***P < 0.001, ****P < 0.0001; ANOVA, Bonferroni’s test, strain effects (C57BL/6J versus rd10), ##P < 0.01, ###P < 0.001.

