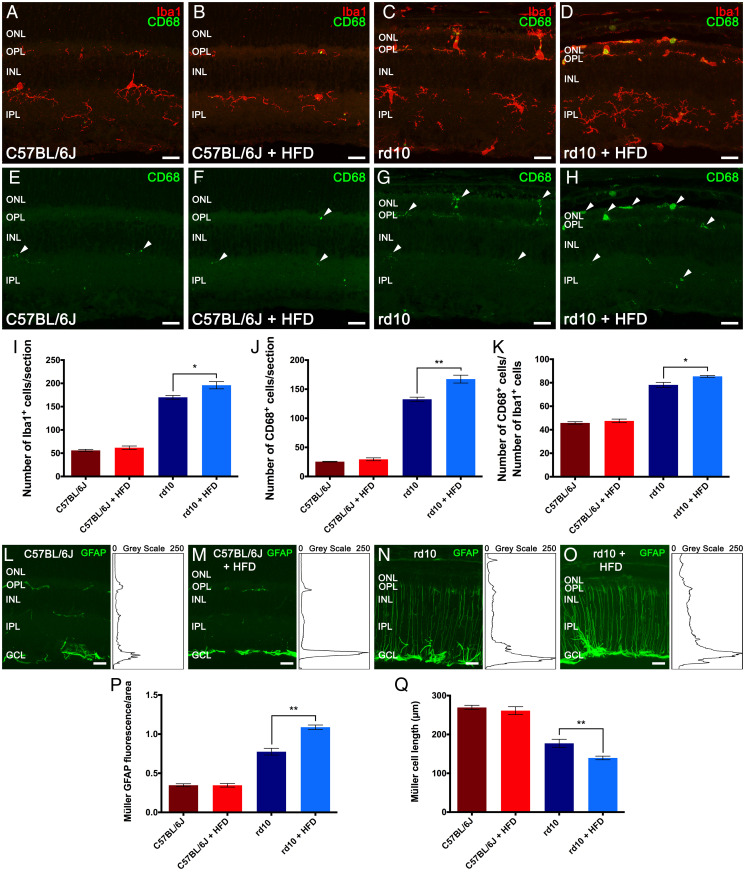
Fig. 4.
High-fat feeding activates retinal glial cells. (A–D) Representative nasal–temporal retina cross-sections from C57BL/6J mice fed normal chow (A) or an HFD (B) and rd10 mice fed a normal (C) or HFD (D) for 2 wk from postnatal day 19 immunolabeled against Iba1 (microglia, in red) and CD68 (phagocytic cells, in green). (E–H) Retina cross-sections of A–D showing CD68 labeling. Arrowheads point to CD68+ microglial cells. (I–K) Average number of Iba1+ (I) and CD68+ cells (J) per retina section and percentage of Iba1+ cells labeled for CD68 (K). (L–O) Retina sections of A–D showing cells immunolabeled for GFAP (activated macroglia, in green). (Insets, Right) The profile plots of mean gray intensity for each horizontal line. (P) Quantification of the differential expression of GFAP. (Q) Average length of Müller cells. Images were collected from the central area of the retina, close to the optic nerve. Mann–Whitney U test, n = 4 for C57BL/6J mice and n = 6 for rd10 mice, *P < 0.05, **P < 0.01. INL: inner nuclear layer, IPL: inner plexiform layer, GCL: ganglion cell layer. (Scale bars: 20 μm.)

