Fig. 5.
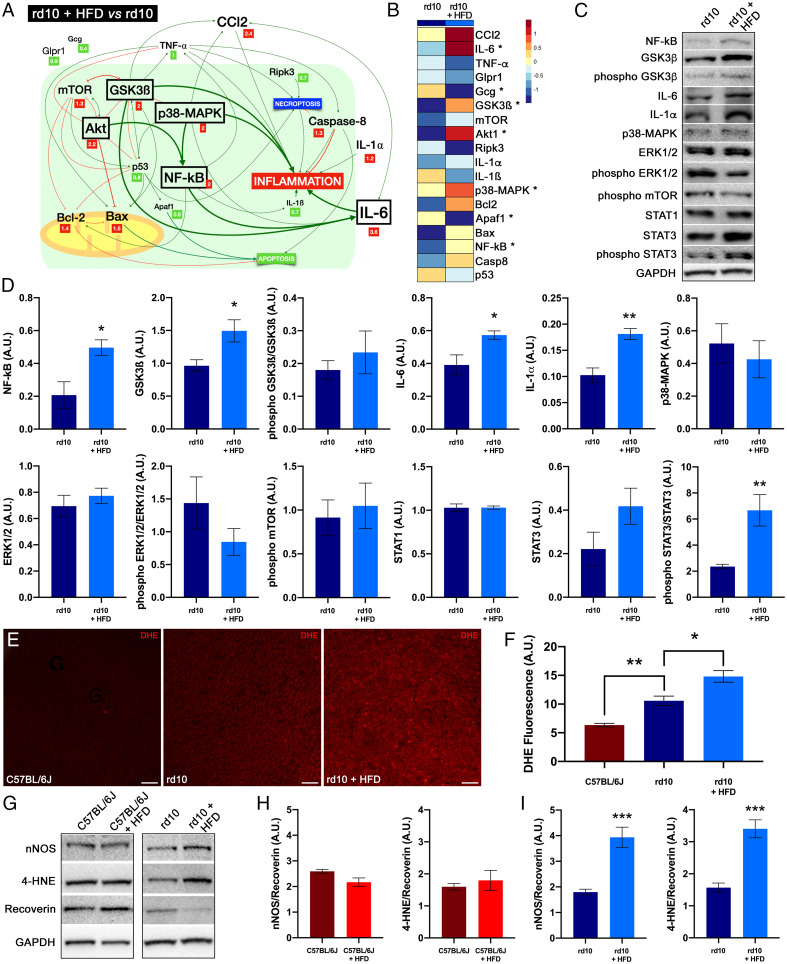
Dietary fat affects cell mediators and oxidative stress. (A) Schematic view showing relative expression levels of cell mediators, their interactions, and their effects on inflammation in rd10 mice. Relative expression (fold change, in squares) of mRNAs in the retina was compared between mice fed a normal or HFD for 2 wk from postnatal day 19. The relative size of the letters represents the relative level of gene expression. Significant increases are marked by a box. (B) Heat map of the mean mRNA expression of cell mediators in rd10 mice fed normal chow or an HFD. Each grid element in the heat map is color‐coded for the corresponding gene expression value. (C and D) Detection of cell mediators by Western blotting in the retina of rd10 mice fed HFD or normal chow. GAPDH levels are shown as loading controls. (E) Whole-mount retinas showing the staining of DHE at the photoreceptor level in a C57BL/6J mouse fed normal chow and rd10 mice fed normal or an HFD. (F) Quantification of DHE fluorescence. (G–I) Detection of nNOS (H) and 4-HNE (I) by Western blotting (G) in the retina of rd10 mice fed an HFD or normal chow. GAPDH levels are shown as loading controls. ANOVA, Bonferroni’s test, diet effects (normal versus HFD) on mRNA levels, n = 4, *P < 0.05; Student’s t test, diet effects (normal versus HFD) on protein levels, n = 4 to 7, *P < 0.05, **P < 0.01, ***P < 0.001; Kruskal–Wallis, Dunn’s test, diet effects (normal versus HFD) on DHE fluorescence, n = 3 to 6, *P < 0.05, **P < 0.01. (Scale bars: 20 μm.)

