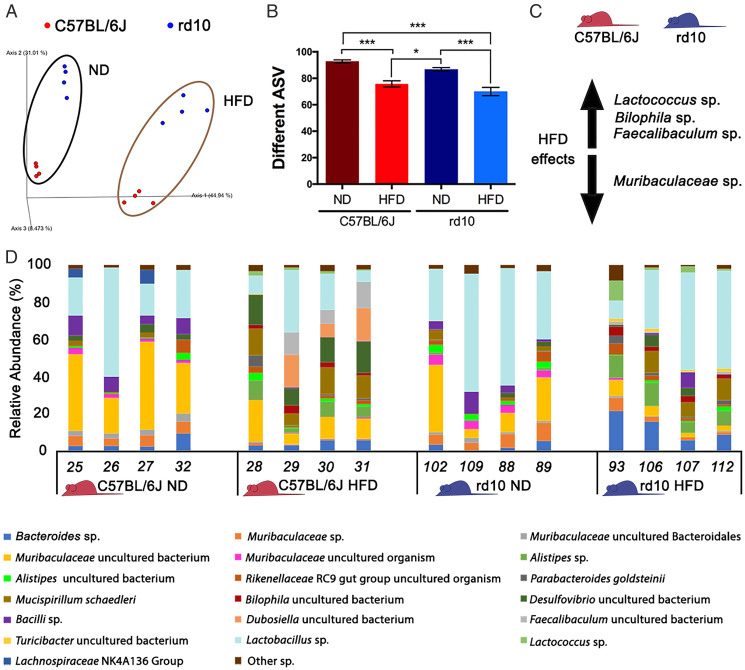
Fig. 6.
Analysis of the mouse gut microbiome. (A) Unweighted UniFrac distance represented as a principal coordinate analysis for rd10 (in blue) and C57BL/6J mice (in red) where the influence of the diet could be observed (ND: normal diet). (B) Richness analysis comparing the number of amplicon sequence variants (ASVs) for C57BL/6J (red bars) or rd10 (blue bars) mice fed a ND or HFD. (C) Main effects of an HFD on the microbiome of the studied mice (C57BL/6J and rd10) regarding species abundance variation according to the ANCOM test. Increase is indicated by the arrow pointing up (Lactococcus sp., Bilophila sp., and Faecalibaculum sp.), whereas decrease is indicated by the arrow pointing down (Muribaculaceae sp.). (D) Relative abundance (%) of gut microbiome species that showed more than 1% of relative abundance in one sample. Bar plot was performed for C57BL/6J (in red) or rd10 mice (in blue) fed ND or HFD. ANOVA, Tukey HSD test, diet and mouse strain effect, n = 4, *P < 0.05, ***P < 0.001.

