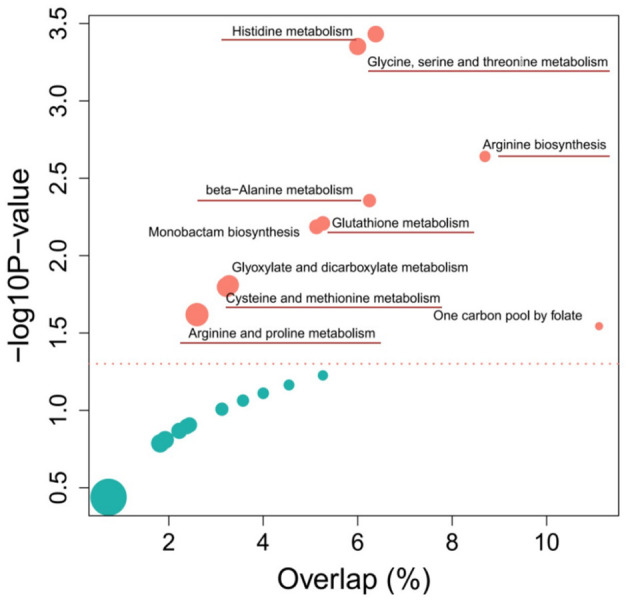
Figure 4.

Top 10 enriched metabolic pathways of the comparison between Sumai 3 and Shannong 20 after F. graminearum infection. The y-axis and x-axis respectively represent the significance and importance value of the metabolic pathway, bubble size represents the differential metabolites (DFMs) proportion in the metabolic pathway. Detailed information on metabolic pathways in Supplementary Table 3.
