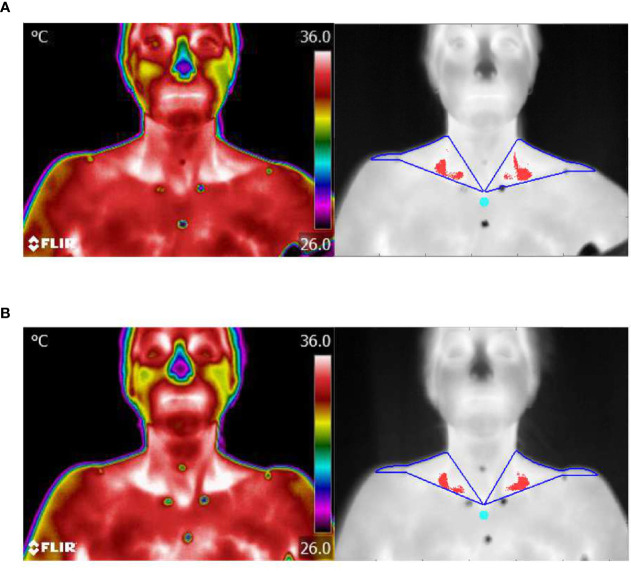
Figure 2.
Thermal imaging. (A) Representative example of thermal images of the skin area overlying neck and upper chest during cold stimulation after 12 weeks of LT4 treatment with corresponding images of the contour of ROI (blue) and hottest 10% of pixels (red) identified in the SCV fossa and sternal reference region (turquoise). (B) Same as for (A), but after 12 weeks of LT3 treatment.

