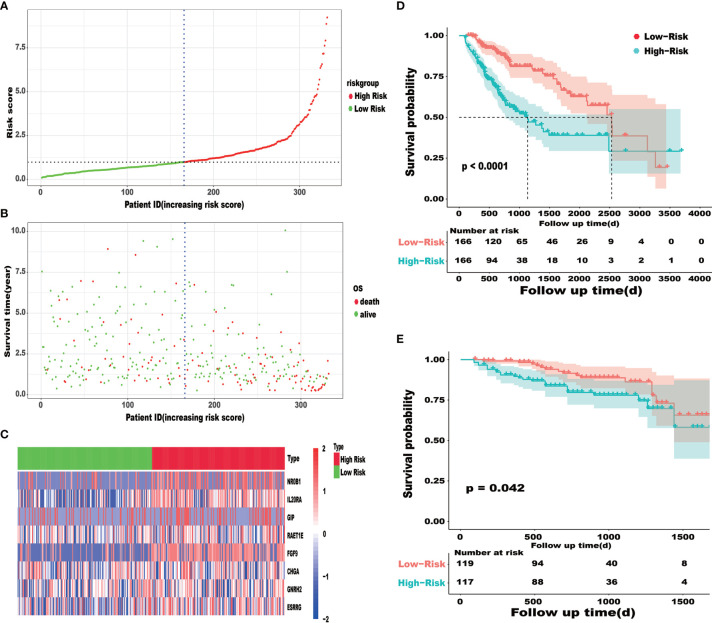
Figure 3.
IRRSM was created by SIRGs (A–C). The distribution of high-risk group and low-risk group (A). Survival status of the high-risk and the low-risk group (B). The heatmap of the expression levels of twelve SIRGs (C); Survival curve for the high risk and low risk groups of HCC patients in the TCGA database (D). Survival curve for the high risk and low risk groups of HCC patients for validation in ICGC database (E).

