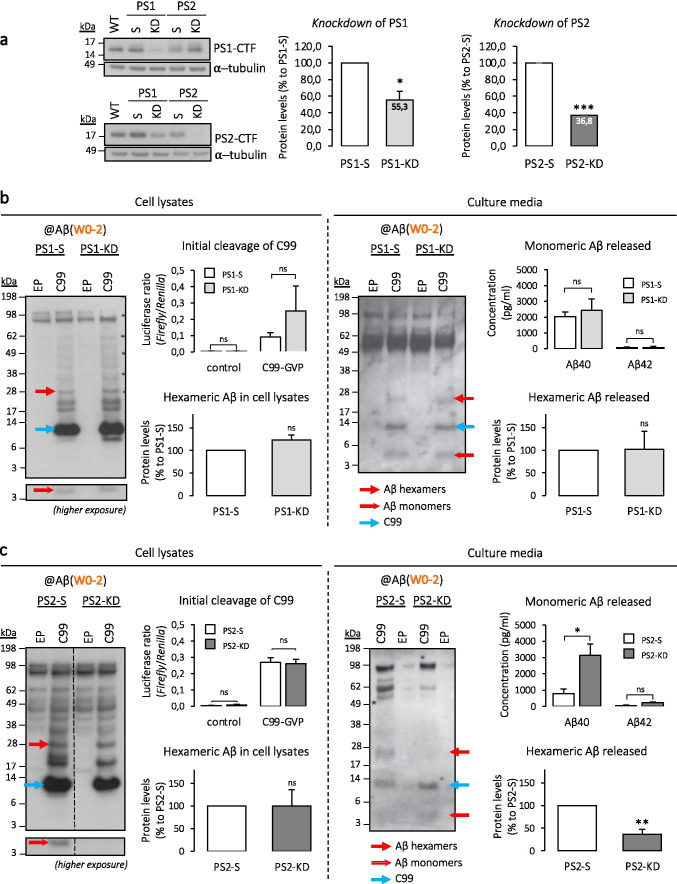
Fig. 3.
Contribution of presenilins to the production of hexameric Aβ assemblies. a SH-SY5Y knockdown (KD) cell lines were generated using CRISPR-Cas9, with guide RNA vectors targeting either human PSEN1 (PS1-KD) or PSEN2 (PS2-KD) genes. Control cells were transfected with respective scrambled sequences. Left, a representative Western blot; middle and right, quantitative decrease in PS1 and PS2 protein levels in KD compared to S cells (for all conditions, see Supplementary Fig.S2). N = 3. One-sample t test with hypothetical value set as 100: *p < 0.05, ***p < 0.001 (S vs KD, in PS1: p = 0.03; in PS2: p = 0.0001). WT wild-type, S scrambled. b, c Initial cleavage ability was monitored by a reporter gene assay. The release of APP intracellular domain (AICD) from a tagged C99-GVP substrate was measured by the Gal4-Firefly reporter gene. Results are represented as Firefly/Renilla luciferases ratios, with Renilla serving as a transfection-efficiency control. The profile of Aβ production was assessed after transfection with either an empty plasmid (EP) or C99, using Western blotting and ECLIA immunoassay, in PS1-KD vs PS1-S (in b) and in PS2-KD vs PS2-S (in c). Media samples were lyophilized prior to analysis. Dashed lines indicate that proteins were run on the same gel, but lanes are not contiguous. Luciferase assays (initial cleavage of C99): N = 4 each. One-way ANOVA with Tukey's multiple comparison test: ns = non-significant (S vs KD, in PS1 control: p > 0.99; in PS1 C99-GVP: p = 0.10; in PS2 control: p = 0.99; in PS2 C99-GVP: p = 0.99). Western blots quantitative analyses (hexameric Aβ, in cell lysates and released, relative to C99 and expressed as a % to S): N = 3 each. One-sample t test with hypothetical value set as 1: ns non-significant, **p < 0.01 (S vs KD, in PS1 cell lysates: p = 0.16; in PS1 media: p = 0.97; in PS2 cell lysates: p = 0.99; in PS2 media: p = 0.01). ECLIA assays (monomeric Aβ released): N = 5 each. Mann–Whitney test: ns non-significant, *p < 0.05 (S vs KD, in PS1 Aβ40: p > 0.99; in PS1 Aβ42: p > 0.99; in PS2 Aβ40: p = 0.04; in PS2 Aβ42: p = 0.12)

