Fig. 6.
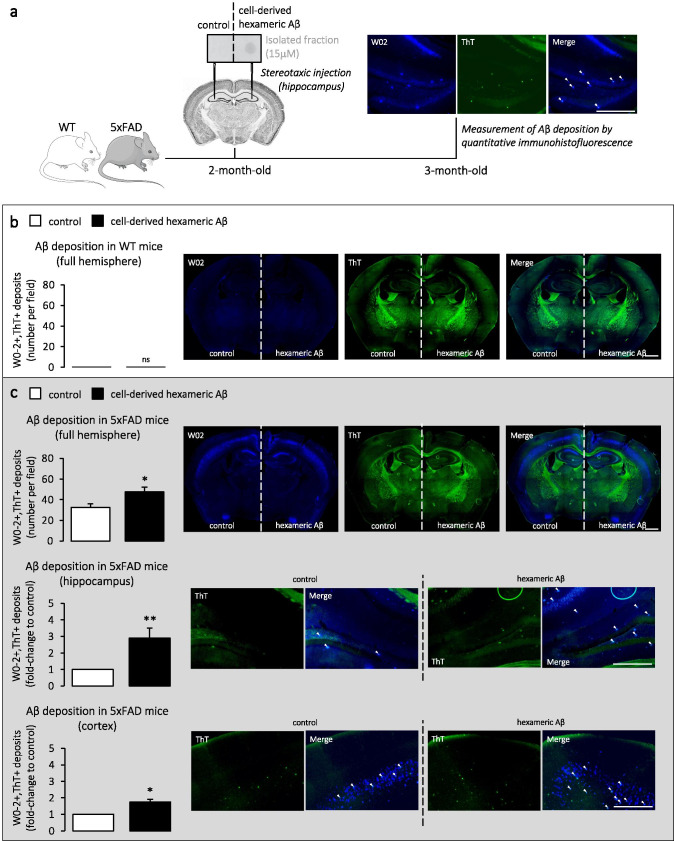
Intracerebral injection of cell-derived hexameric Aβ in WT and 5xFAD mice. a Experimental workflow. 2-month-old mice were deeply anesthetized, placed in a stereotaxic apparatus and bilaterally injected with 2 μl of either 15 μM GELFrEE™-isolated Aβ hexamers (C42) or control (EP) in the hippocampus (A/P − 1.94; L + − 2.17; D/V − 1.96; mm relative to bregma). Both fractions were analyzed by dot blotting prior to injection. 30 days later, mice were transcardially perfused, brains were fixed, and coronally sectioned (50 μm). Immunostaining was performed on free-floating sections using the anti-human Aβ (W0-2) antibody as a marker for Aβ and the Thioflavin T (ThT) dye as a marker for fibrillar deposits. W0-2 and ThT staining were detected with FITC/Cy5 and GFP filters, respectively. Right panel displays an example of double-positive counting. Scale bar = 400 μm. b, c Quantification of fibrillar deposits in full hemispheres of WT (in b) and 5xFAD brains (in c. upper panel) injected with control vs hexameric Aβ. Scale bar = 1000 μm. n = 32 slides from N = 8 mice for both WT and 5xFAD. Mann–Whitney test: ns non-significant, *p < 0.05 (in WT: p > 0.99 control vs hexameric Aβ; in 5xFAD: p = 0.04 control vs hexameric Aβ). For transgenic mice, deposits were also classified according to the two most affected brain regions, hippocampus and cortex, as a function of the control-injected hemisphere (in c middle and lower panel, scale bar = 400 μm). A 2.90-fold and a 1.74-fold increase were observed in the hippocampus and cortex, respectively. One-sample Wilcoxon signed-rank test with hypothetical value set at 1: *p < 0.05, **p < 0.01 (in 5xFAD hippocampus: p = 0.008 control vs hexameric Aβ; in 5xFAD cortex: p = 0.02 control vs hexameric Aβ)

