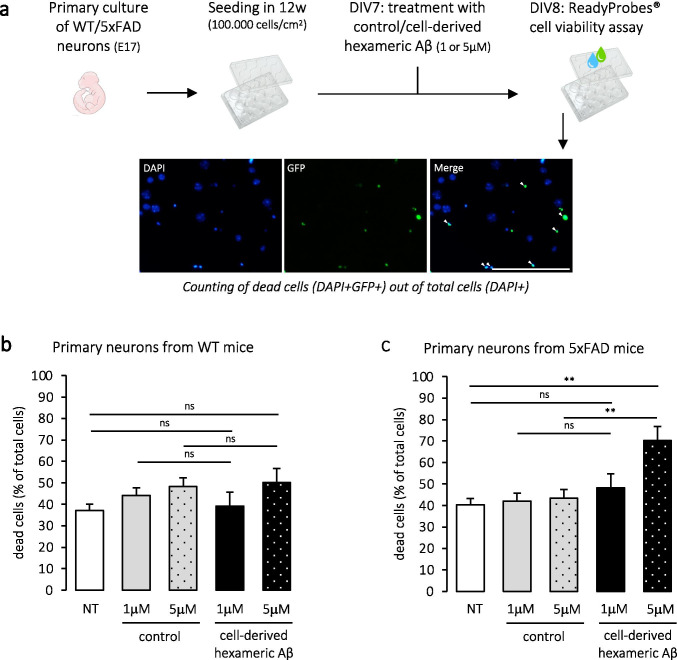
Fig. 7.
Cell-derived hexameric Aβ assemblies are only cytotoxic in primary neurons that express amyloid proteins. a Experimental workflow. Primary neurons were isolated from wild-type (WT) or transgenic (5xFAD) mouse embryos at stage E17 and cultured for 8 days in vitro (DIV). At DIV7, cells were incubated for 24 h with 1 µM or 5 µM of cell-derived hexameric Aβ or control, isolated from the media of C42- and EP-expressing CHO cells, respectively. Cell viability was assessed using the ReadyProbes® assay and fluorescent staining was captured at an EVOS® FL Autofluorescence microscope. A representative image of the assay is shown. Scale bar = 50 μm. b, c Quantification of the proportion of dead cells compared to the total cells in WT (in b) and 5xFAD cultures (in c). Total number of cells counted (number of dead cells counted in brackets) was as follows in WT: n = 1183(439), 1070(472), 650(314), 813(318), 797(400), and 5xFAD: n = 528(212), 640(270), 1019(442), 465(224), 775(544) for NT, control (equivalent of 1 μM), control (equivalent of 5 μM), hexameric Aβ (1 μM), and hexameric Aβ (5 μM) respectively. NT not treated. N = 4 independent experiments in WT, N = 3 independent experiments in 5xFAD. One-way ANOVA with Tukey's multiple comparison test: ns non-significant, *p < 0.05, **p < 0.01 (in WT: p = 0.99 NT vs hexameric Aβ (1 μM), p = 0.38 NT vs hexameric Aβ (5 μM), p = 0.95 control (1 μM) vs hexameric Aβ (1 μM), p = 0.97 control (5 μM) vs hexameric Aβ (5 μM); in 5xFAD: p = 0.70 NT vs hexameric Aβ (1 μM), p = 0.004 NT vs hexameric Aβ (5 μM), p = 0.85 control (1 μM) vs hexameric Aβ (1 μM), and p = 0.009 control (5 μM) vs hexameric Aβ (5 μM))

