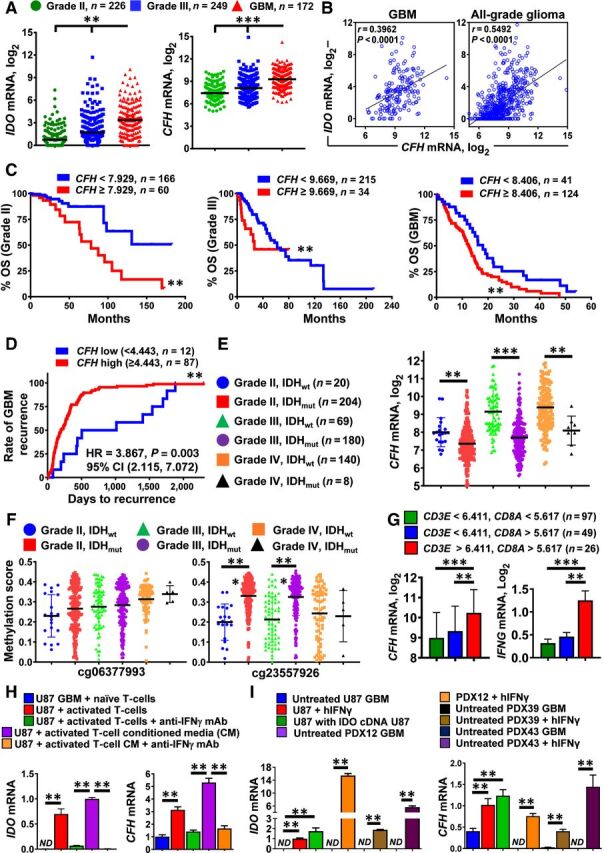
Figure 3.

IDO and CFH mRNA levels positively correlate with T-cell infiltration in patient-resected GBM. A, mRNA expression levels for IDO and CFH in grade II (green; n = 226), grade III (blue; n = 249), and grade IV (GBM; red; n = 172) glioma of the RNA Hi-Seq. Illumina dataset as analyzed in TCGA. Horizontal lines in the scatter plots represent mean ± SEM. B, Pearson correlation analysis for IDO and CFH mRNA levels within GBM and all-grade glioma. C, Kaplan–Meier survival analysis of grade II (left), grade III (center), and grade IV (GBM, right) patients with glioma stratified by low CFH (blue) and high CFH (red) expression levels. D, Kaplan–Meier analysis of GBM recurrence. Recurrent GBM samples were identified from the ‘days to tumor recurrence’ section listed in the TCGA GBM clinical dataset. CFH mRNA expression levels were extracted from the Affymetrix U133a microarray dataset. E, CFH mRNA levels were compared among grade II (IDHwt; blue circle and IDHmut; red square), grade III (IDHwt; green triangle and IDHmut; purple circle), as well as grade IV (IDHwt; orange circle and IDHmut; black triangle) glioma. F, CFH DNA methylation analysis at two distinct genomic loci, cg06377993 and cg23557926 in grade II (IDHwt; blue circle and IDHmut; red square), grade III (IDHwt; green triangle and IDHmut; purple circle), and grade IV (IDHwt; orange circle and IDHmut; black triangle) glioma. G, Expression of CFH and IFNγ mRNA levels in patient-resected GBM tissue samples as categorized by CD3E and CD8A expression levels while accessing the TCGA GBM RNA-seq dataset. H, Detection of CFH mRNA in the human GBM cell T-cell coculture system in vitro. CD3+ human T cells were isolated under positive selection from PBMCs of patients with GBM. CFH mRNA levels were analyzed in U87 GBM cells cocultured with either naïve or activated T cells or conditioned medium from activated T cells in the presence or absence of IFNγ-neutralizing antibodies. Data were compiled from 3 independent experiments. I, In vitro expression analysis of human CFH mRNA in different GBM cells with or without the addition of human IFNγ. Data represent pooled data from 4 independent experiments. **, P < 0.01; ***, P < 0.001. All bar graphs represent mean ± SEM.
