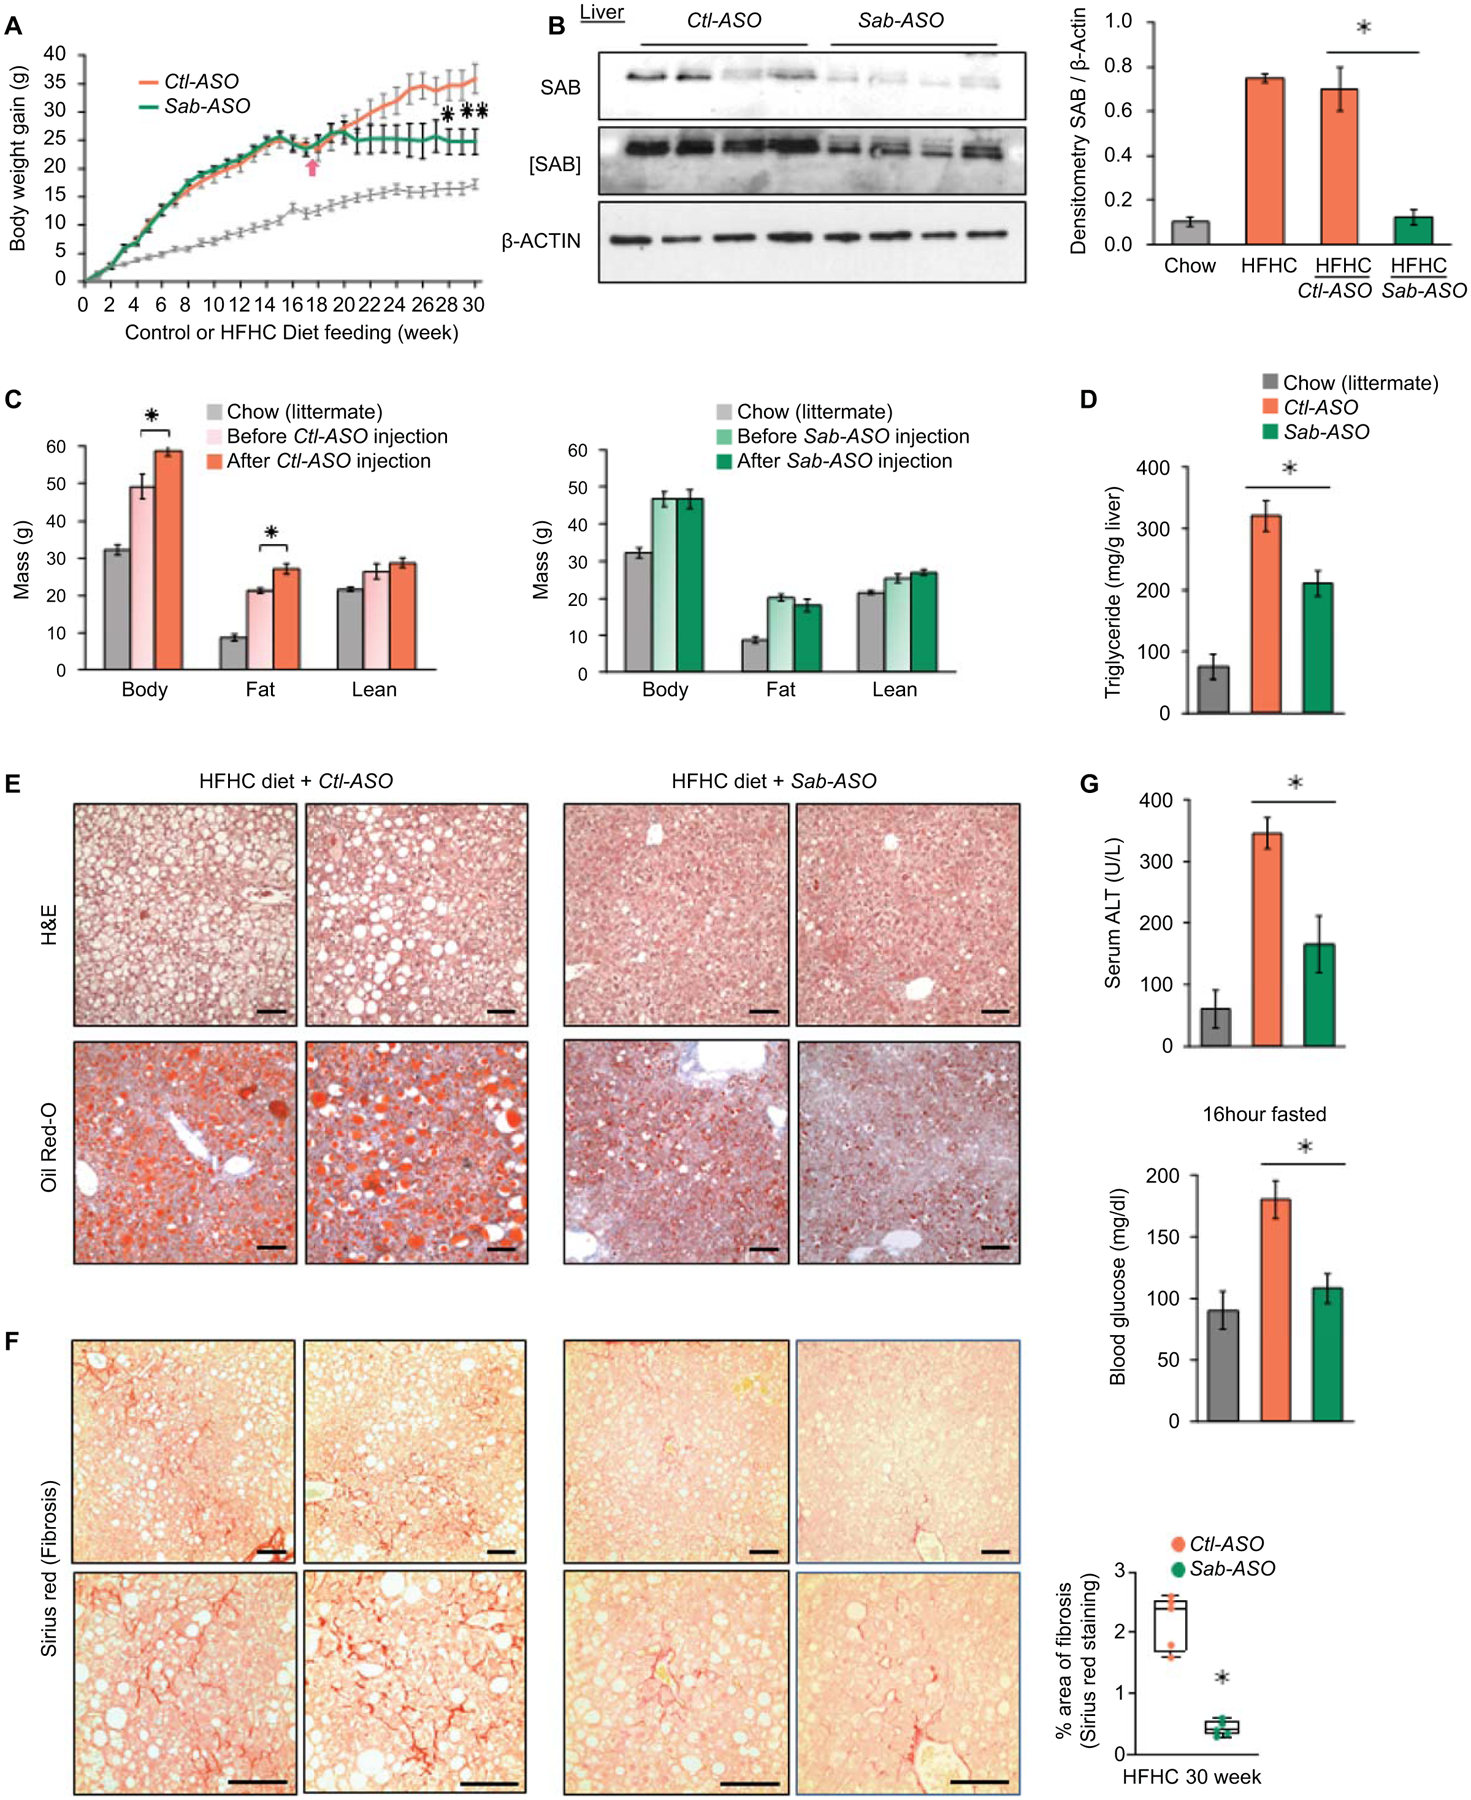
Fig.4. ASO treatment suppresses Sab expression and progression of steatohepatitis and fibrosis.

Male wild type littermates were fed HFHC diet for 30 weeks. Mice were treated with Control-ASO (Ctl-ASO) or Sab-ASO 25mg/kg ip three times per week starting after 17 weeks of HFHC diet. (A) Weight gain in mice fed HFHC diet, n=6 mice/group; chow diet fed mice shown as gray line. (B) Level of SAB after Sab-ASO injection in HFHC fed mice at week 30. Each lane represents a single mouse liver; n=4 mice per group. Representative image of 3 separate blots. Densitometry results shown as bar graph. All data shown as mean ± SEM. ✱=p<0.05 Sab-ASO versus Control-ASO by unpaired, 2-tailed Student’s t-test. (C) Body composition of Ctl-ASO or Sab-ASO treated groups before versus after 12 weeks course of ASO injections. n=5–6 mice/group, ✱=p<0.05 after- versus before-ASO by paired, 2-tailed Student’s t-test. (D) Liver triglyceride, (E) Representative histology images of H&E, Oil-Red-O and (F) Sirius red staining (scale bar = 100μm) and quantitation of area of fibrosis. (G) Serum ALT and fasting blood glucose examined at 30 weeks of HFHC feeding with ASO injections for the last 12 weeks. All data shown as mean ± SEM. n=5–6 mice/group. ✱=p<0.05 Sab-ASO versus Control-ASO by unpaired 2-tailed Student’s t-test.
