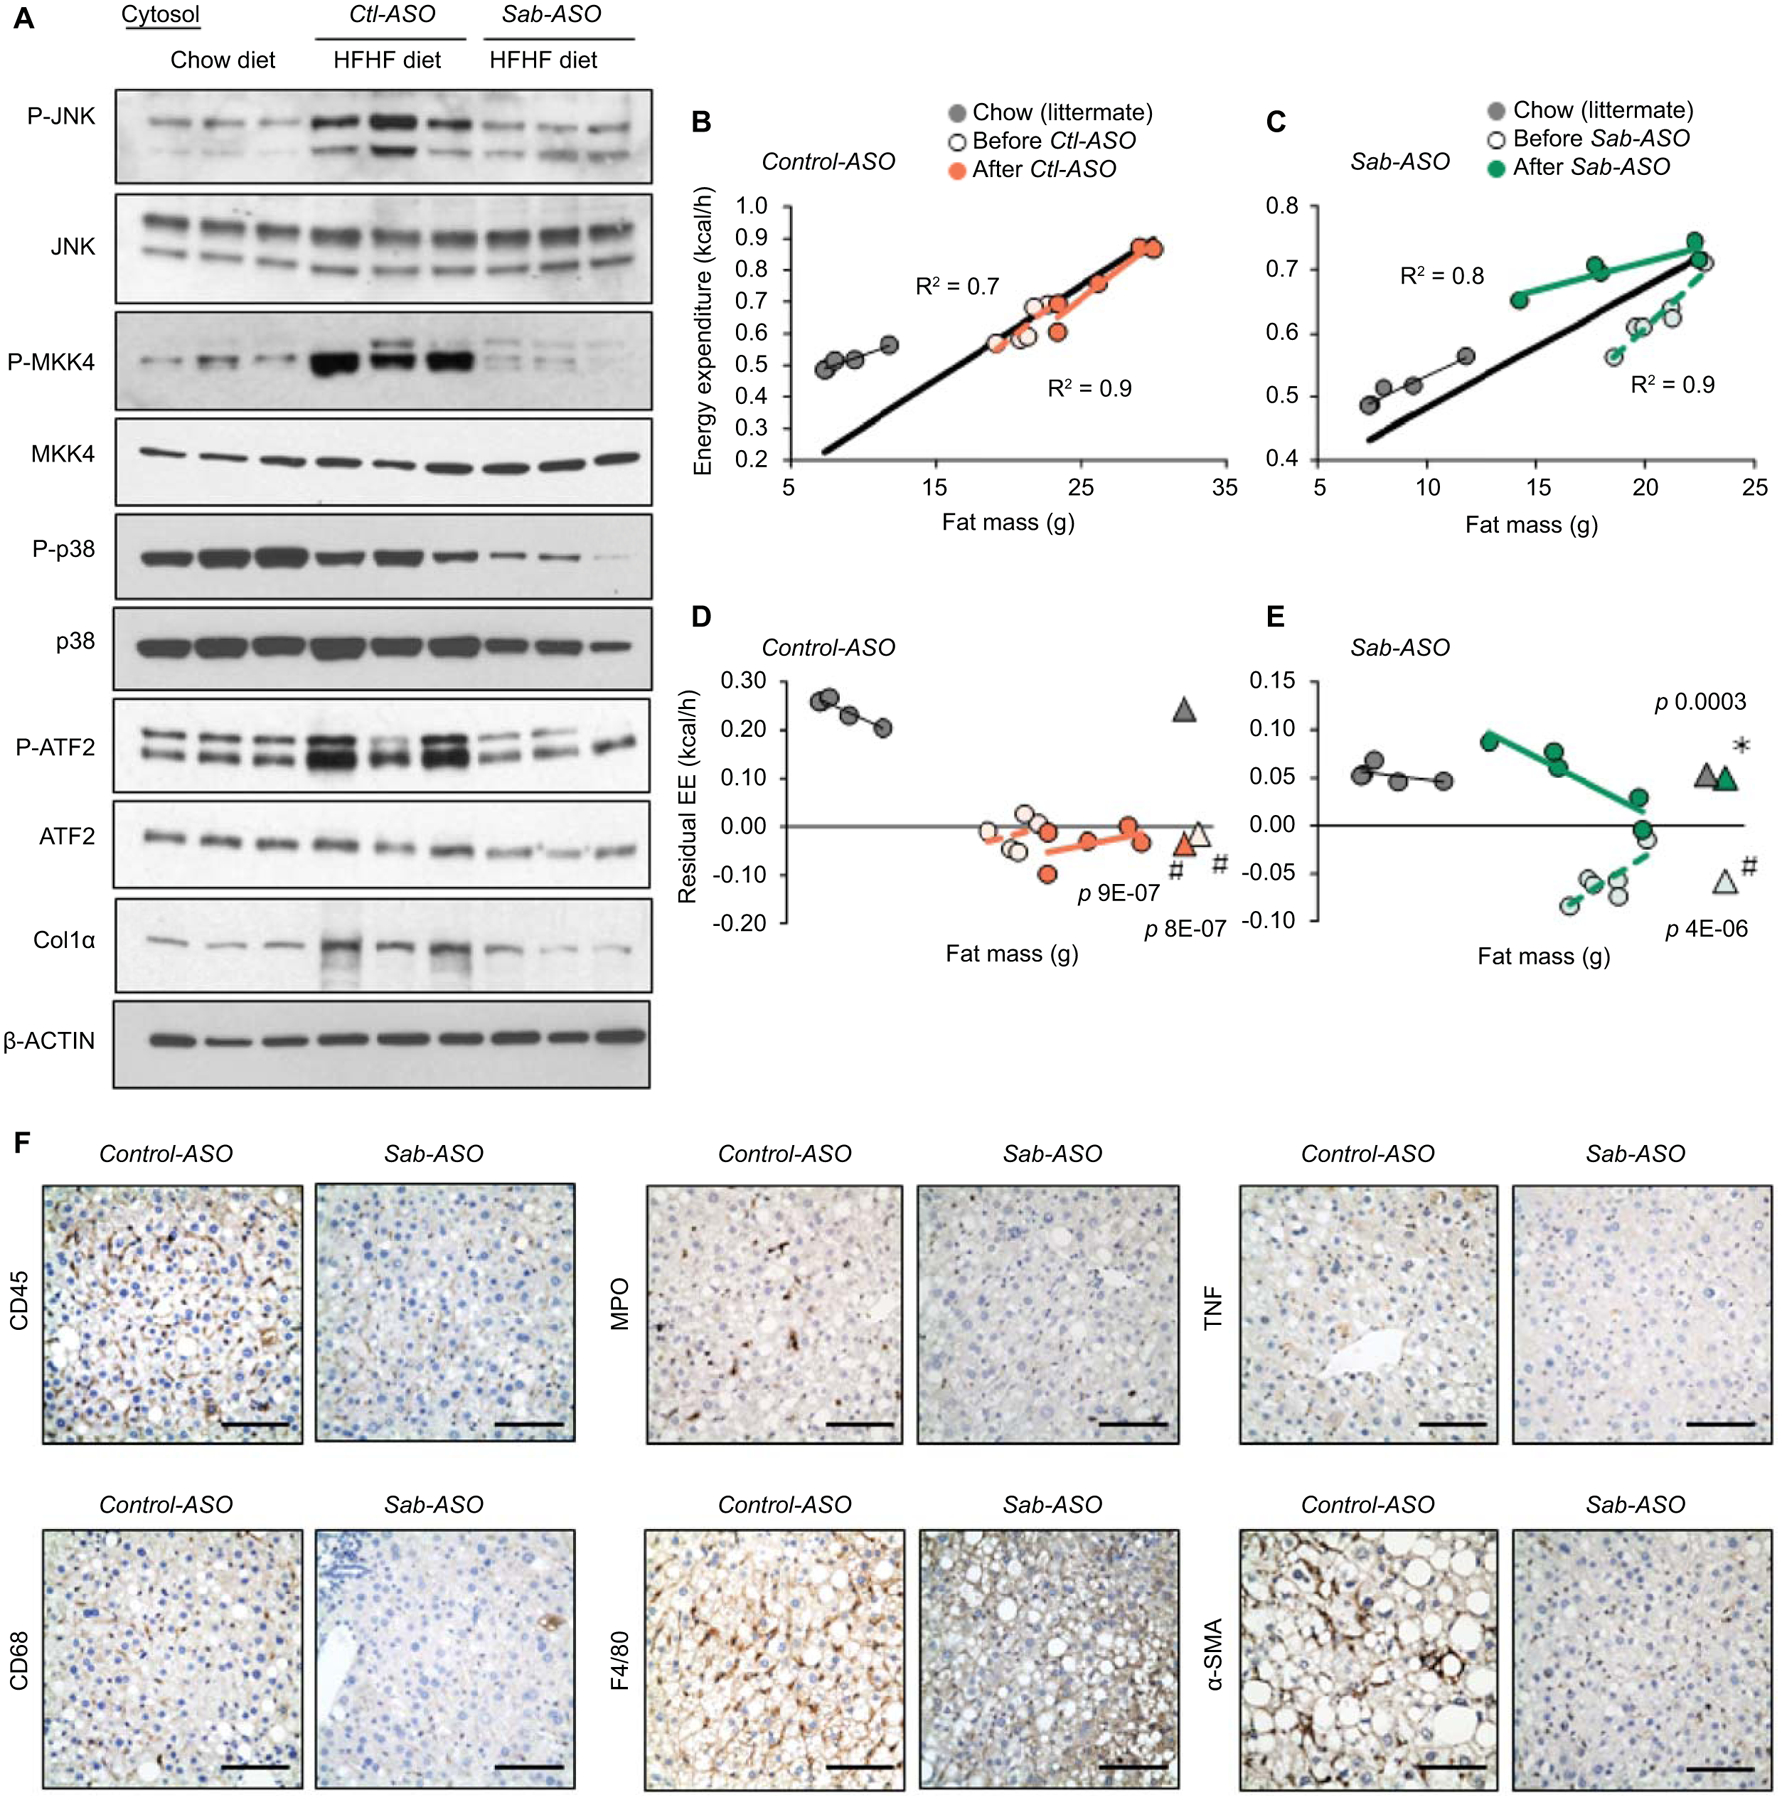
Fig.5. Sab knockdown prevents decreased energy expenditure, hepatic inflammation and fibrosis.

Feeding and ASO as in Fig.4. (A) Immunoblot of JNK, p38, ATF2 and MKK4 and phospho-forms, and Col1α. β-Actin is the loading control. Each lane represents a single mouse liver; n=4 mice/group. Representative images of 3 separate blots. (B,C) Regression plot of EE and (D,E) residual EE before and after ASO treatment of the same mice. Regression plot of residual EE against fat mass. Mean values of residual EE shown as (Δ). Statistical significance (p<0.05) of EE in HFHC vs chow fed groups shown as (#), before vs after ASO treatment shown as (✱)determined by ANCOVA. n=5–6 mice/group. (F) Representative IHC of liver sections from Control-ASO (Ctl-ASO) or Sab-ASO treated mice fed the HFHC diet for 30 weeks. CD45, CD68, MPO, F4/80, TNF and α–SMA stained in formalin fixed paraffin embedded tissue sections and color developed by DAB substrate. n=5–6 mice/group. Scale bar = 100μm.
