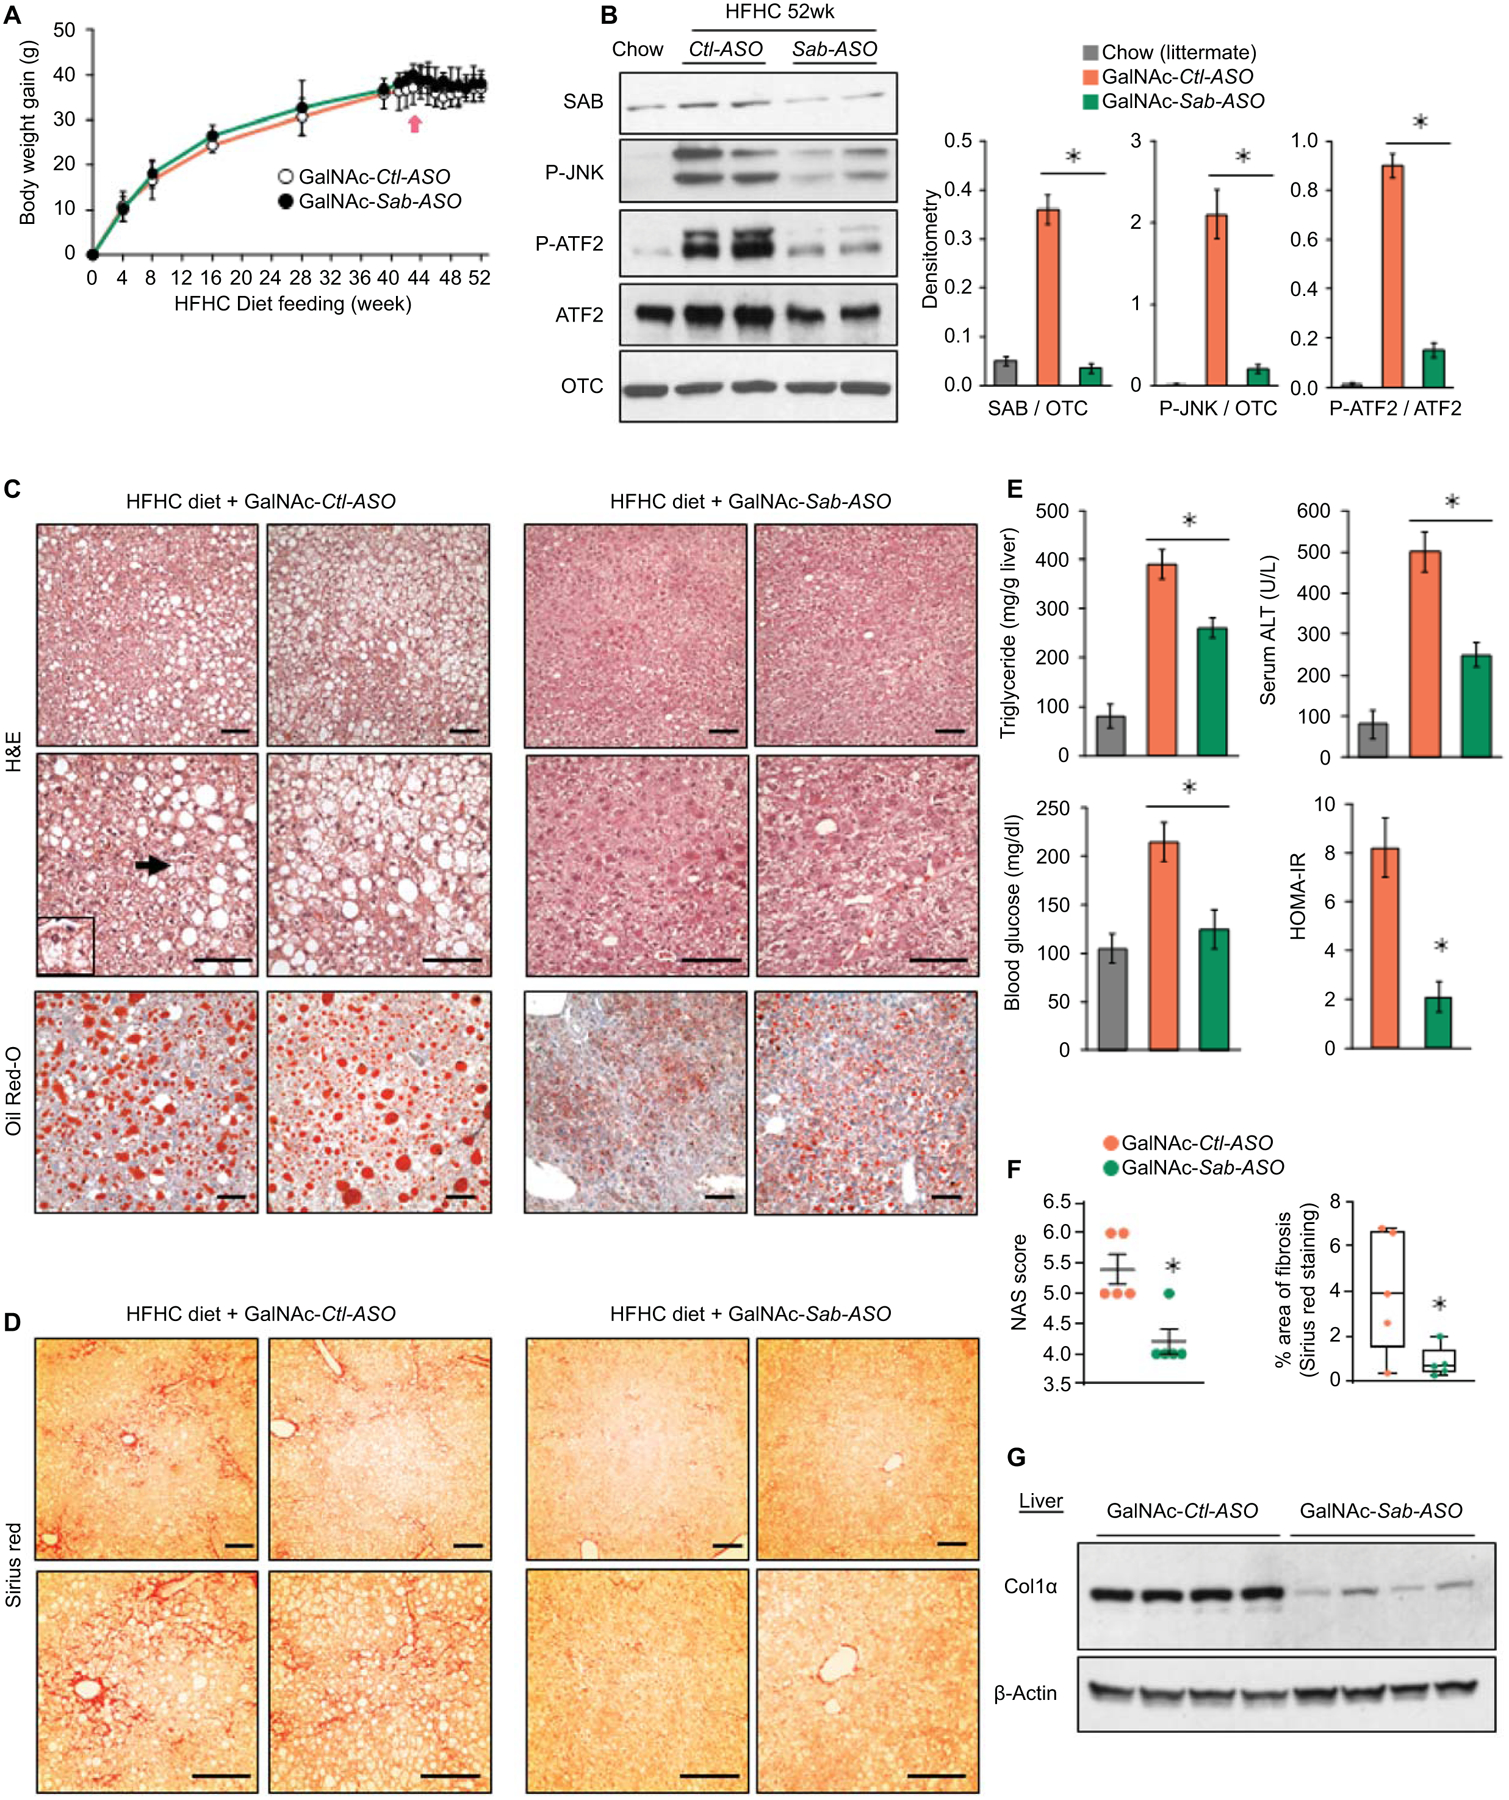
Fig.6. Hepatic specific GalNAc-Sab-ASO treatment.

Male wild type littermates were fed HFHC diet for 52 weeks. Mice were given GalNAc-Control-ASO (GalNAc-Ctl-ASO) or GalNAc-Sab-ASO 2.5mg/kg ip three times per week starting after 42 weeks of HFHC diet. n=6 mice/group. (A) Time course of body weight gain (B) Immunoblots of SAB, P-JNK, JNK, P-ATF2 and ATF2; OTC, loading control. Representative of 3 separate experiments. Each lane is a single mouse liver. Bar graph of densitometry of 5 mice/group, ✱=p<0.05, unpaired, 2-tailed Student’s t-test. (C) Representative images of H&E and Oil-Red-O staining of liver sections of HFHC diet fed mice after 10 weeks course of ASO injections. Ballooned hepatocyte (arrow and insert). Scale bar = 100μm. (D) Sirius red staining. (E,F) Bar graphs of liver triglyceride, serum ALT, fasting blood glucose, HOMA-IR, NAS score, and area of fibrosis. Area of fibrosis of Sirius red stain quantitated by Image-J. Each dot is an average of 5–10 fields per mouse (10x magnification). n=5–6 mice/group. ✱=p < 0.05 GalNAc-Sab-ASO versus GalNAc-Ctl-ASO by unpaired, 2-tailed Student’s t-test. (G) Immunoblot of sonicated tissue lysate using anti-Col1α. β-Actin, loading control. Representative immunoblots from 3 separate experiments. Each lane is a single mouse liver.
