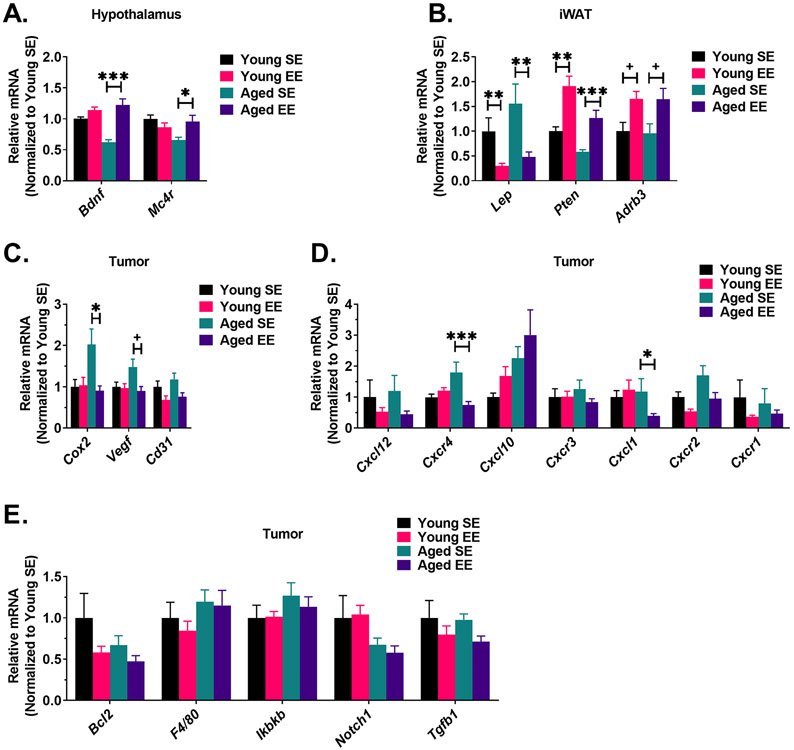
Figure 4. EE alters metabolic and inflammatory biomarkers in central and peripheral tissues.
(A) Gene expression profile of hypothalamic tissue (n=6 per group). (B) Gene expression profile of iWAT (n=6 per group). (C) Gene expression profile of LLC tumors (Young SE n=9, Young EE n=8, Aged SE n=9, Aged EE n=9). (D) C-X-C motif chemokine ligand and receptor gene expression in LLC tumors (Young SE n=9, Young EE n=8, Aged SE n=9, Aged EE n=9). (E) Inflammation gene expression profile of LLC tumors (Young SE n=9, Young EE n=8, Aged SE n=9, Aged EE n=9). Data are means ± SEM. SE vs. EE: + P < 0.06, * P < 0.05, ** P < 0.01, *** P<0.001.

