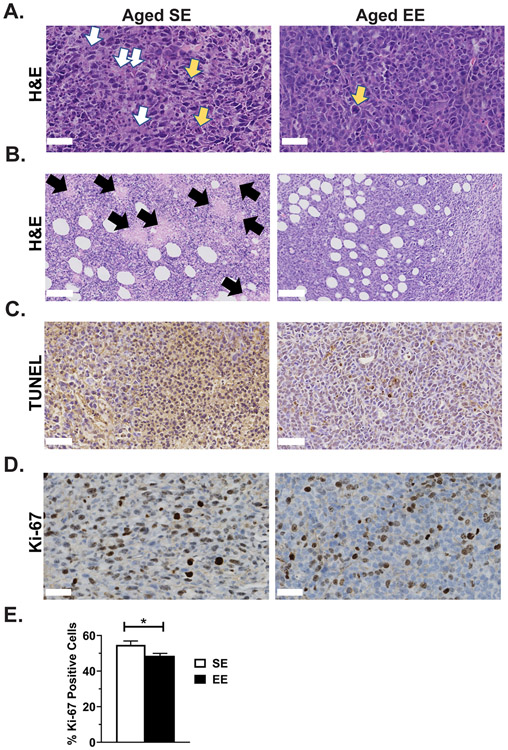
Figure 6. Enriched environment alters tumor pathology and reduces proliferation in aged mice.
(A) Representative H&E staining of LLC tumors (400X, 50 μm scale bar, yellow arrows indicate abnormal mitotic figures, white arrows indicate necrosis and apoptosis). (B) Additional representative H&E staining of LLC tumors (200X, 100 μm scale bar, black arrows indicate necrotic foci). (C) Representative TUNEL staining for apoptosis in LLC tumors (400X, 50 μm scale bar). (D) Representative Ki-67 staining for proliferation in LLC tumors (400X, 50 μm scale bar). (E) Percentage of tumor cells positive for Ki-67 proliferation stain (n=7 animals per group, 3 images per animal). Data are means ± SEM. SE vs. EE: * P < 0.05.

