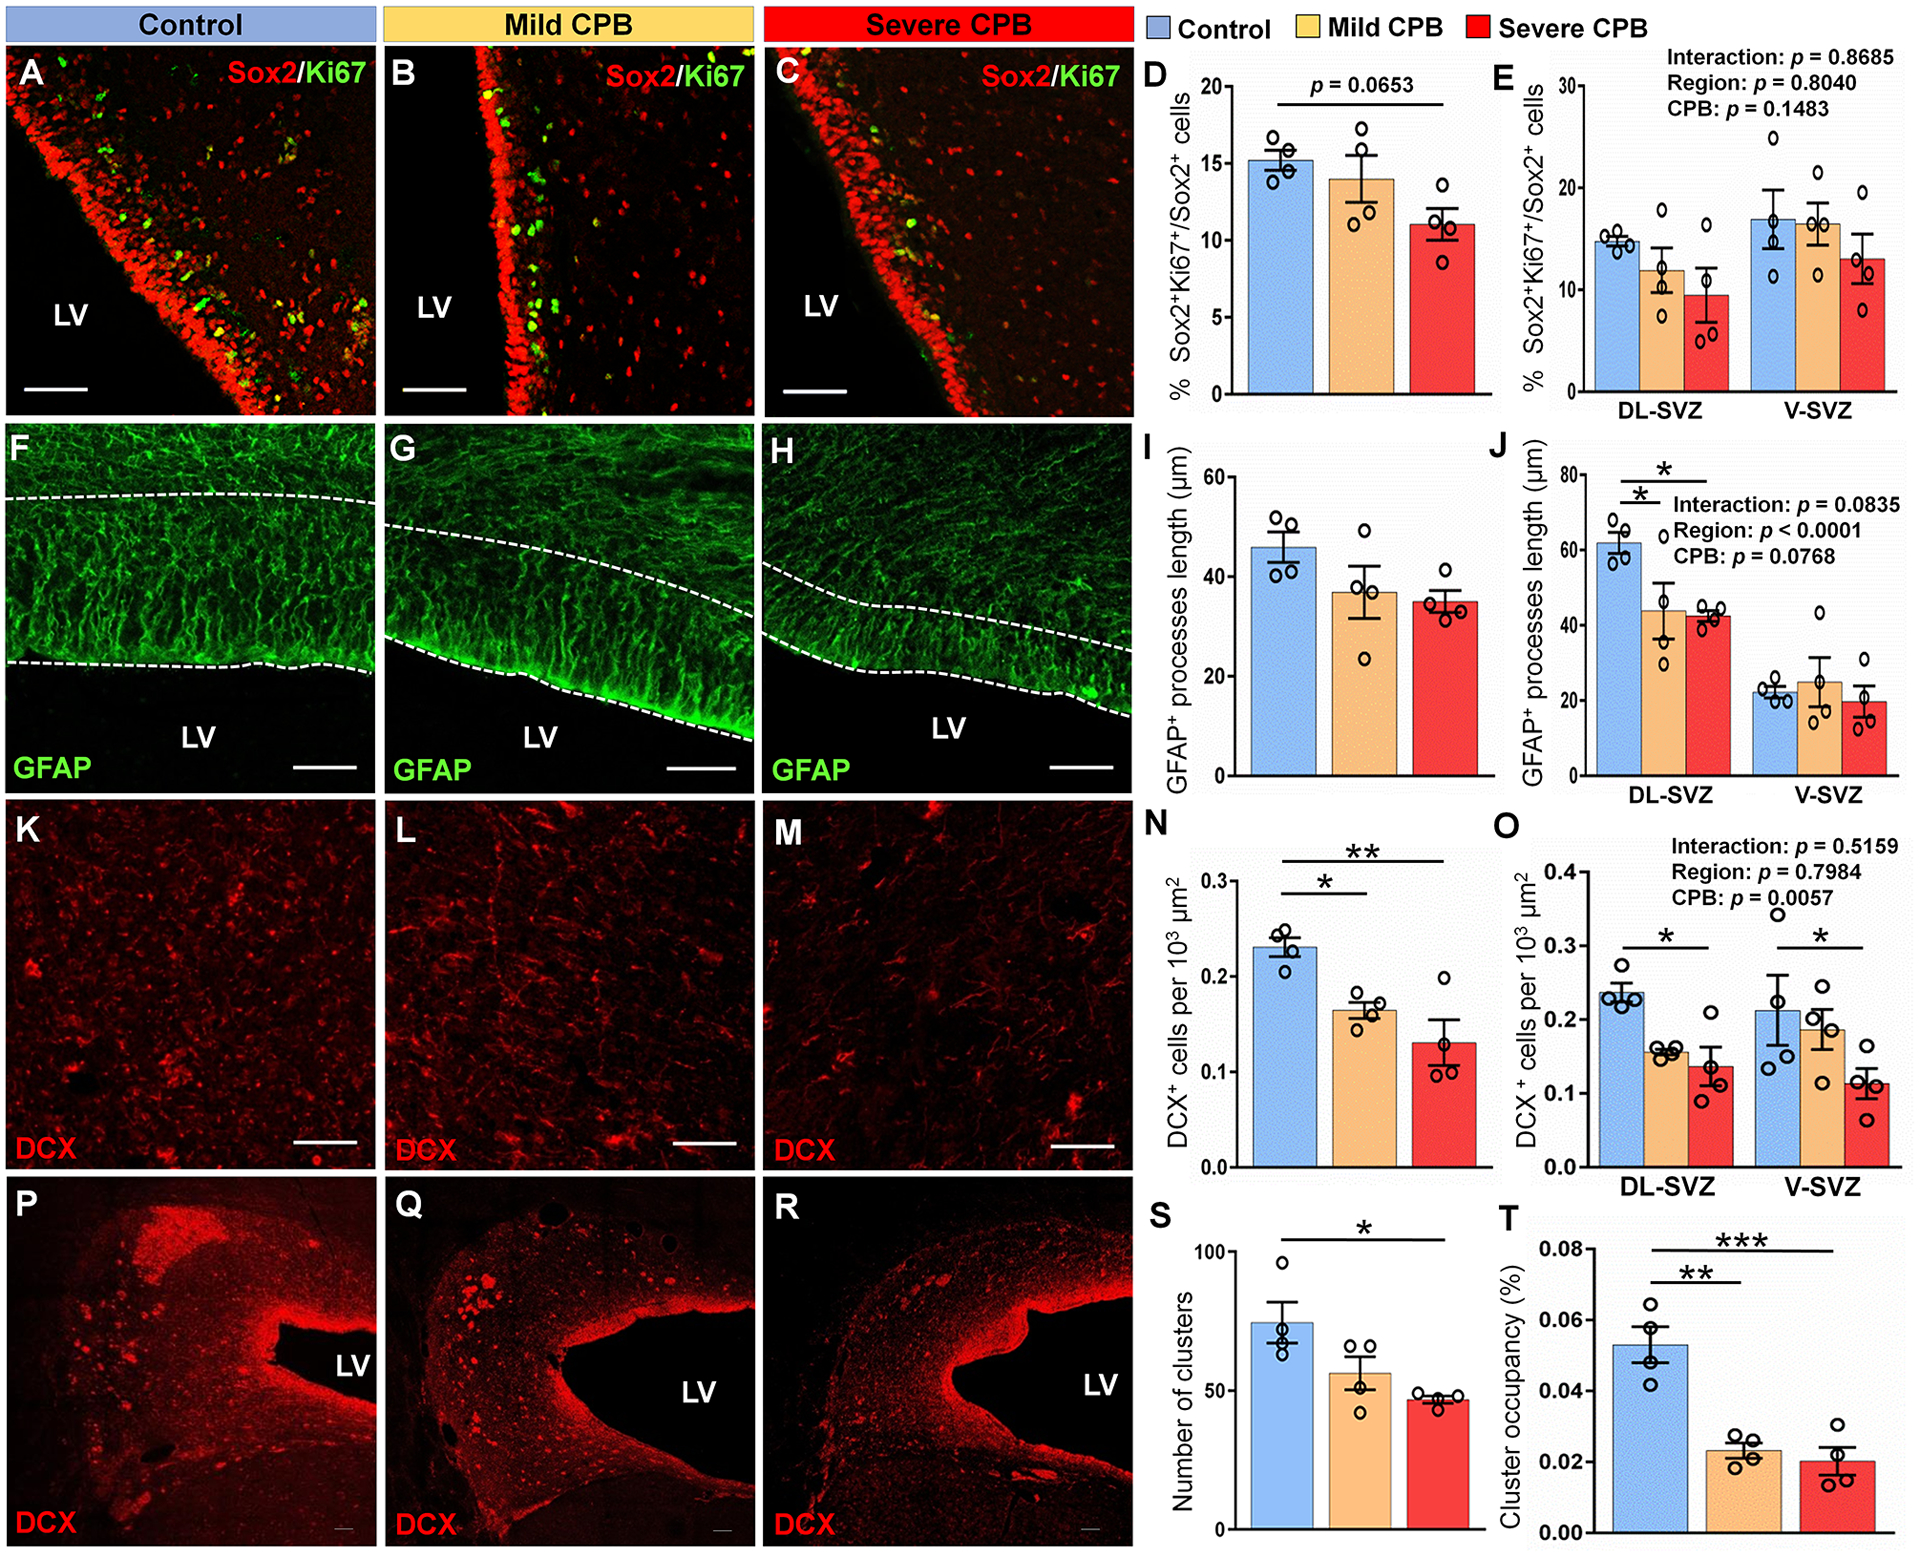
Figure 2. CPB impairs postnatal neurogenesis in the piglet SVZ 3 days post-surgery.

(A-C) Immunostains of Sox2+Ki67+ cells in the DL-SVZ. (D, E) Quantification of the percentage of proliferative Sox2+ neural stem/progenitor cells. (F-H) Immunostains of GFAP in the DL-SVZ. (I, J) Quantification of the average length of GFAP+ processes. (K-M) Immunostains of DCX+ cells in tiers 2–3 of the DL-SVZ. (N, O) Quantification of the average density of DCX+ cells. (P-R) Coronal sections of the SVZ showing immunostains of DCX+ cell clusters. (S) Quantification of the average number of DCX+ cell clusters. (T) Quantification of the average cluster occupancy of the SVZ. Scale bars, 50 μm (A, B, C, F, G, H, K, L, M) and 100 μm (P, Q, R). n = 4 animals per group. Data are expressed as mean ± SEM. *p < 0.05, **p < 0.01, ***p < 0.001, one-way ANOVA with Tukey’s post-hoc test (D, I, N, S, T) and two-way ANOVA with Tukey’s post-hoc test (E, J, O). CPB, cardiopulmonary bypass; DL-SVZ, dorsolateral-SVZ; DCX, doublecortin; LV, lateral ventricle; SVZ, subventricular zone; V-SVZ, ventral-SVZ; GFAP, glial fibrillary acidic protein.
