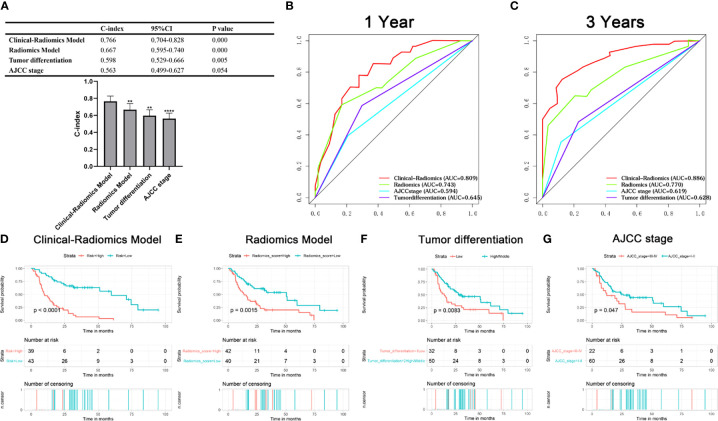
Figure 7.
Kaplan-Meier survival curve, C-index, and AUC were compared among the models. (A) C-index of models; (B, C) AUC of the models for predicting OS at 1, and 3 years; (D–G) Kaplan-Meier survival curve showed OS risk stratification by the clinical-radiomics model, radiomics model, tumor differentiation systems and AJCC 8th edition for ICC patients.

