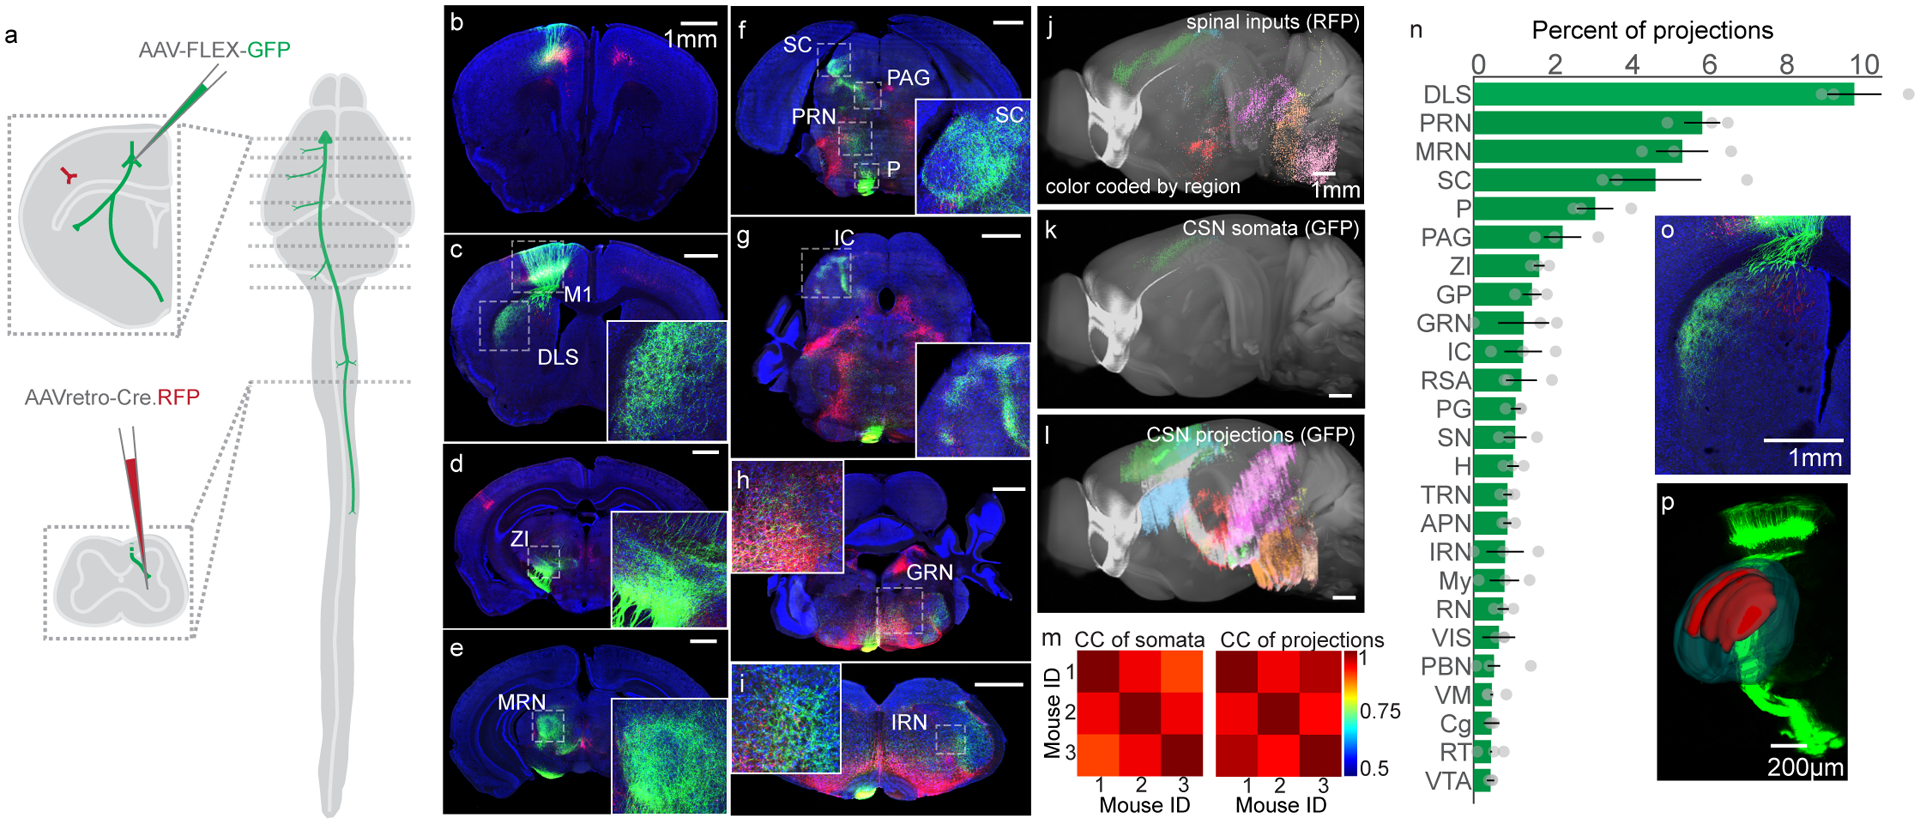
Figure 1. Anatomical characterization of corticospinal neurons.

(A) Schematic illustrating the viral injection sites in motor cortex and the spinal cord, and their relative positions in the nervous system. Dashed lines indicate the position of representative images to follow. (B-I) Confocal micrographs of transverse sections throughout the brain, illustrating GFP+ CSNs and their axonal projections (green), along with all spinal inputs made to express Cre.RFP (red). Some regions of interest are boxed by dashed lines and include: primary motor cortex (M1), dorsolateral striatum (DLS), zona incerta (ZI), midbrain reticular nucleus (MRN), superior colliculus (SC), pons (P), periaqueductal grey (PAG), pontine reticular nucleus (PRN), inferior colliculus (IC), gigantocellular reticular nucleus (GRN), and intermediate reticular nucleus (IRN). DAPI is in blue. Representative of N=3. (J-L) Three dimensional reconstructions of spinal inputs (J), CSN somata (K), and CSN neurites (L) throughout the brain. Colors correspond to major brain divisions in which they reside. Note that the most caudal portion of brainstem is not included in these analyses. (M) Correlation analyses of mesoscopic animal-to-animal CSN somata locations (left) and CSN neurites locations (right). (N) Top brain regions to which CSNs project, measured as what fraction of all bins of neurites are found within those brain structures, excluding sensorimotor cortex and fiber tracts (additional structures not defined above: GP: globus pallidus, RSA: retrosplenial area, PG: pontine grey, SN: substantia nigra, H: hypothalamus, TRN: tegmental reticular nucleus, APN: anterior pretectal nucleus, IRN: intermediate reticular nucleus, My: medulla, RN: red nucleus, VIS: visual areas, PBN: parabrachial nucleus, VM: ventromedial nucleus of the thalamus, Cg: cingulate, RT: reticular nucleus of the thalamus, VTA: ventral tegmental area. N=3 mice (O) A high-magnification micrograph of DLS. Representative of N=3. (P) An Imaris 3D reconstructions of DLS (dark green) and CSN axonal labeling in DLS (red) superimposed over a 3D projection of GFP labeling. Representative of N=3. Error bars are SEM.
