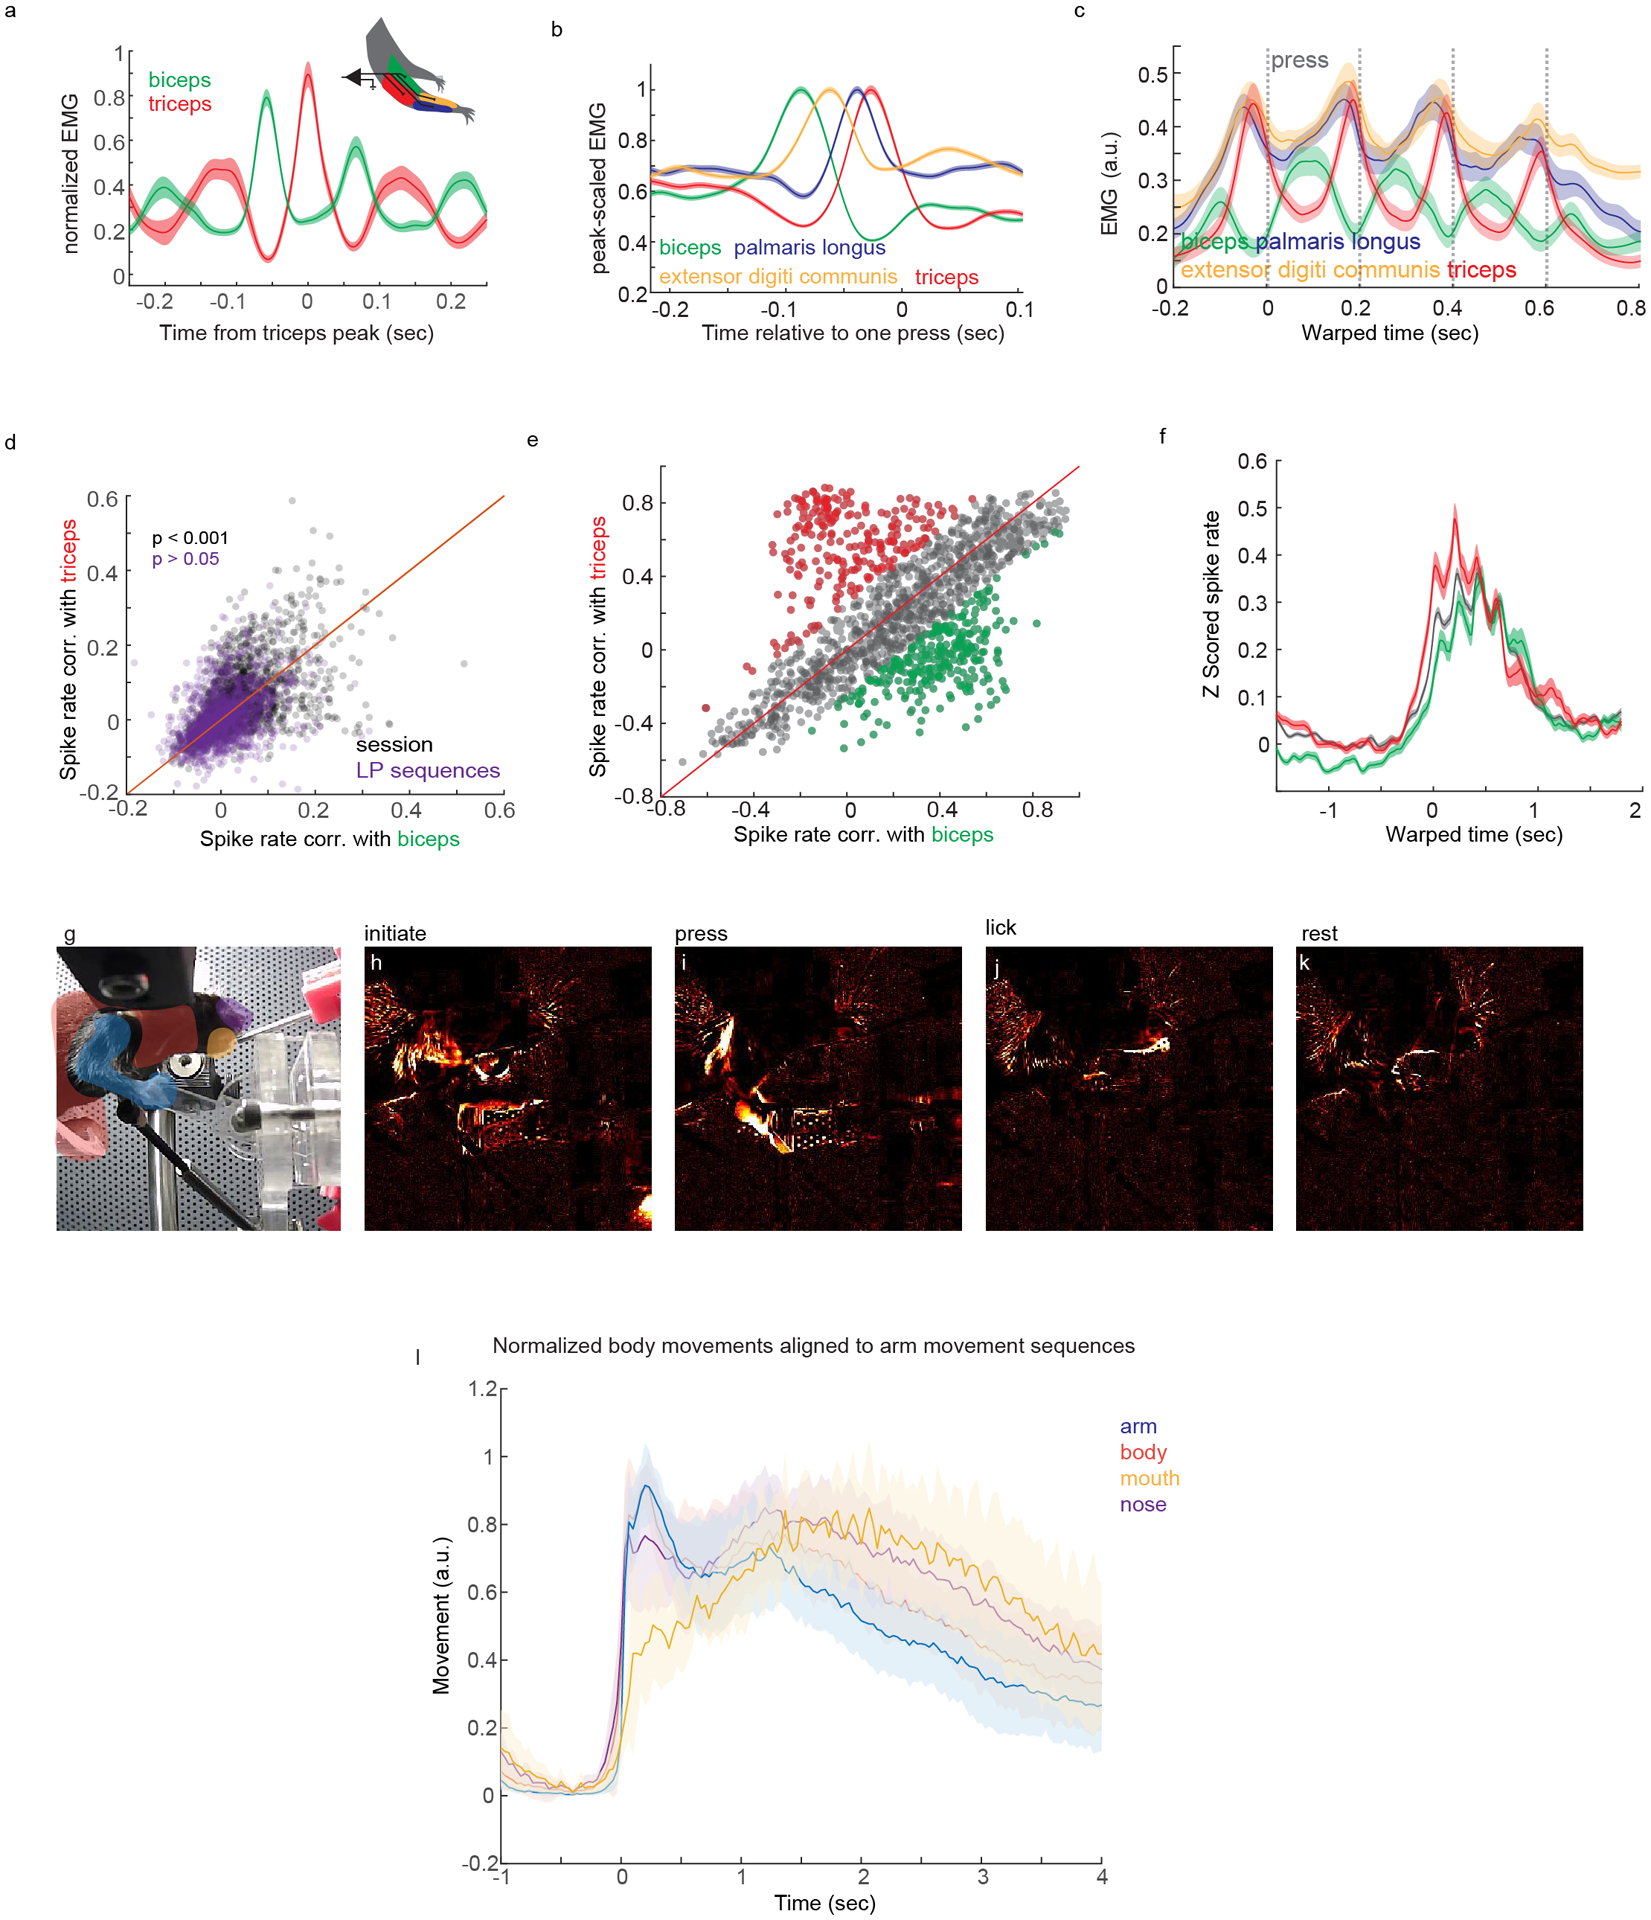
Extended Data Fig. 9. Analysis of EMG during behavior and CSN activity correlations to EMG.

(A) Example recording of biceps and triceps muscle activity from one mouse. Biceps EMG is aligned to peaks in triceps EMG. (B) Average EMG activity for four forelimb muscles aligned to single lever presses. (C) Average EMG activity for four forelimb muscles aligned to lever press sequences. (D) Correlation of CSN activity to biceps versus triceps EMG during concatenated random segments of behavior and rest (grey) or concatenated lever press sequences (purple), matched in duration. Paired two-sided t-tests, concatenated random segments: p=6.66×10⁻⁷; concatenated lever press sequences: p=0.722, N=8, n=2252. (E) Correlation of trial-averaged CSN activity with biceps or triceps EMG. Neurons with correlations biased to triceps or biceps are colorized in red or green, respectively. (F) Average lever press sequence-related activity of CSNs highly correlated to triceps (red) or biceps (green) EMG. Activity from neurons with similar correlation coefficients is in grey. (G-L) Analysis of body movements during behavior. (G) A video still with highlighted regions of interest used for quantifying body movements. (H-K) Images of variance from the same vantage as (G) revealing different body parts moving during the behavior. (L) Variance from different body regions of interest aligned to the onset of arm movement sequences. Notice the absence of overt body movements before arm movement. Shaded area is SEM.
