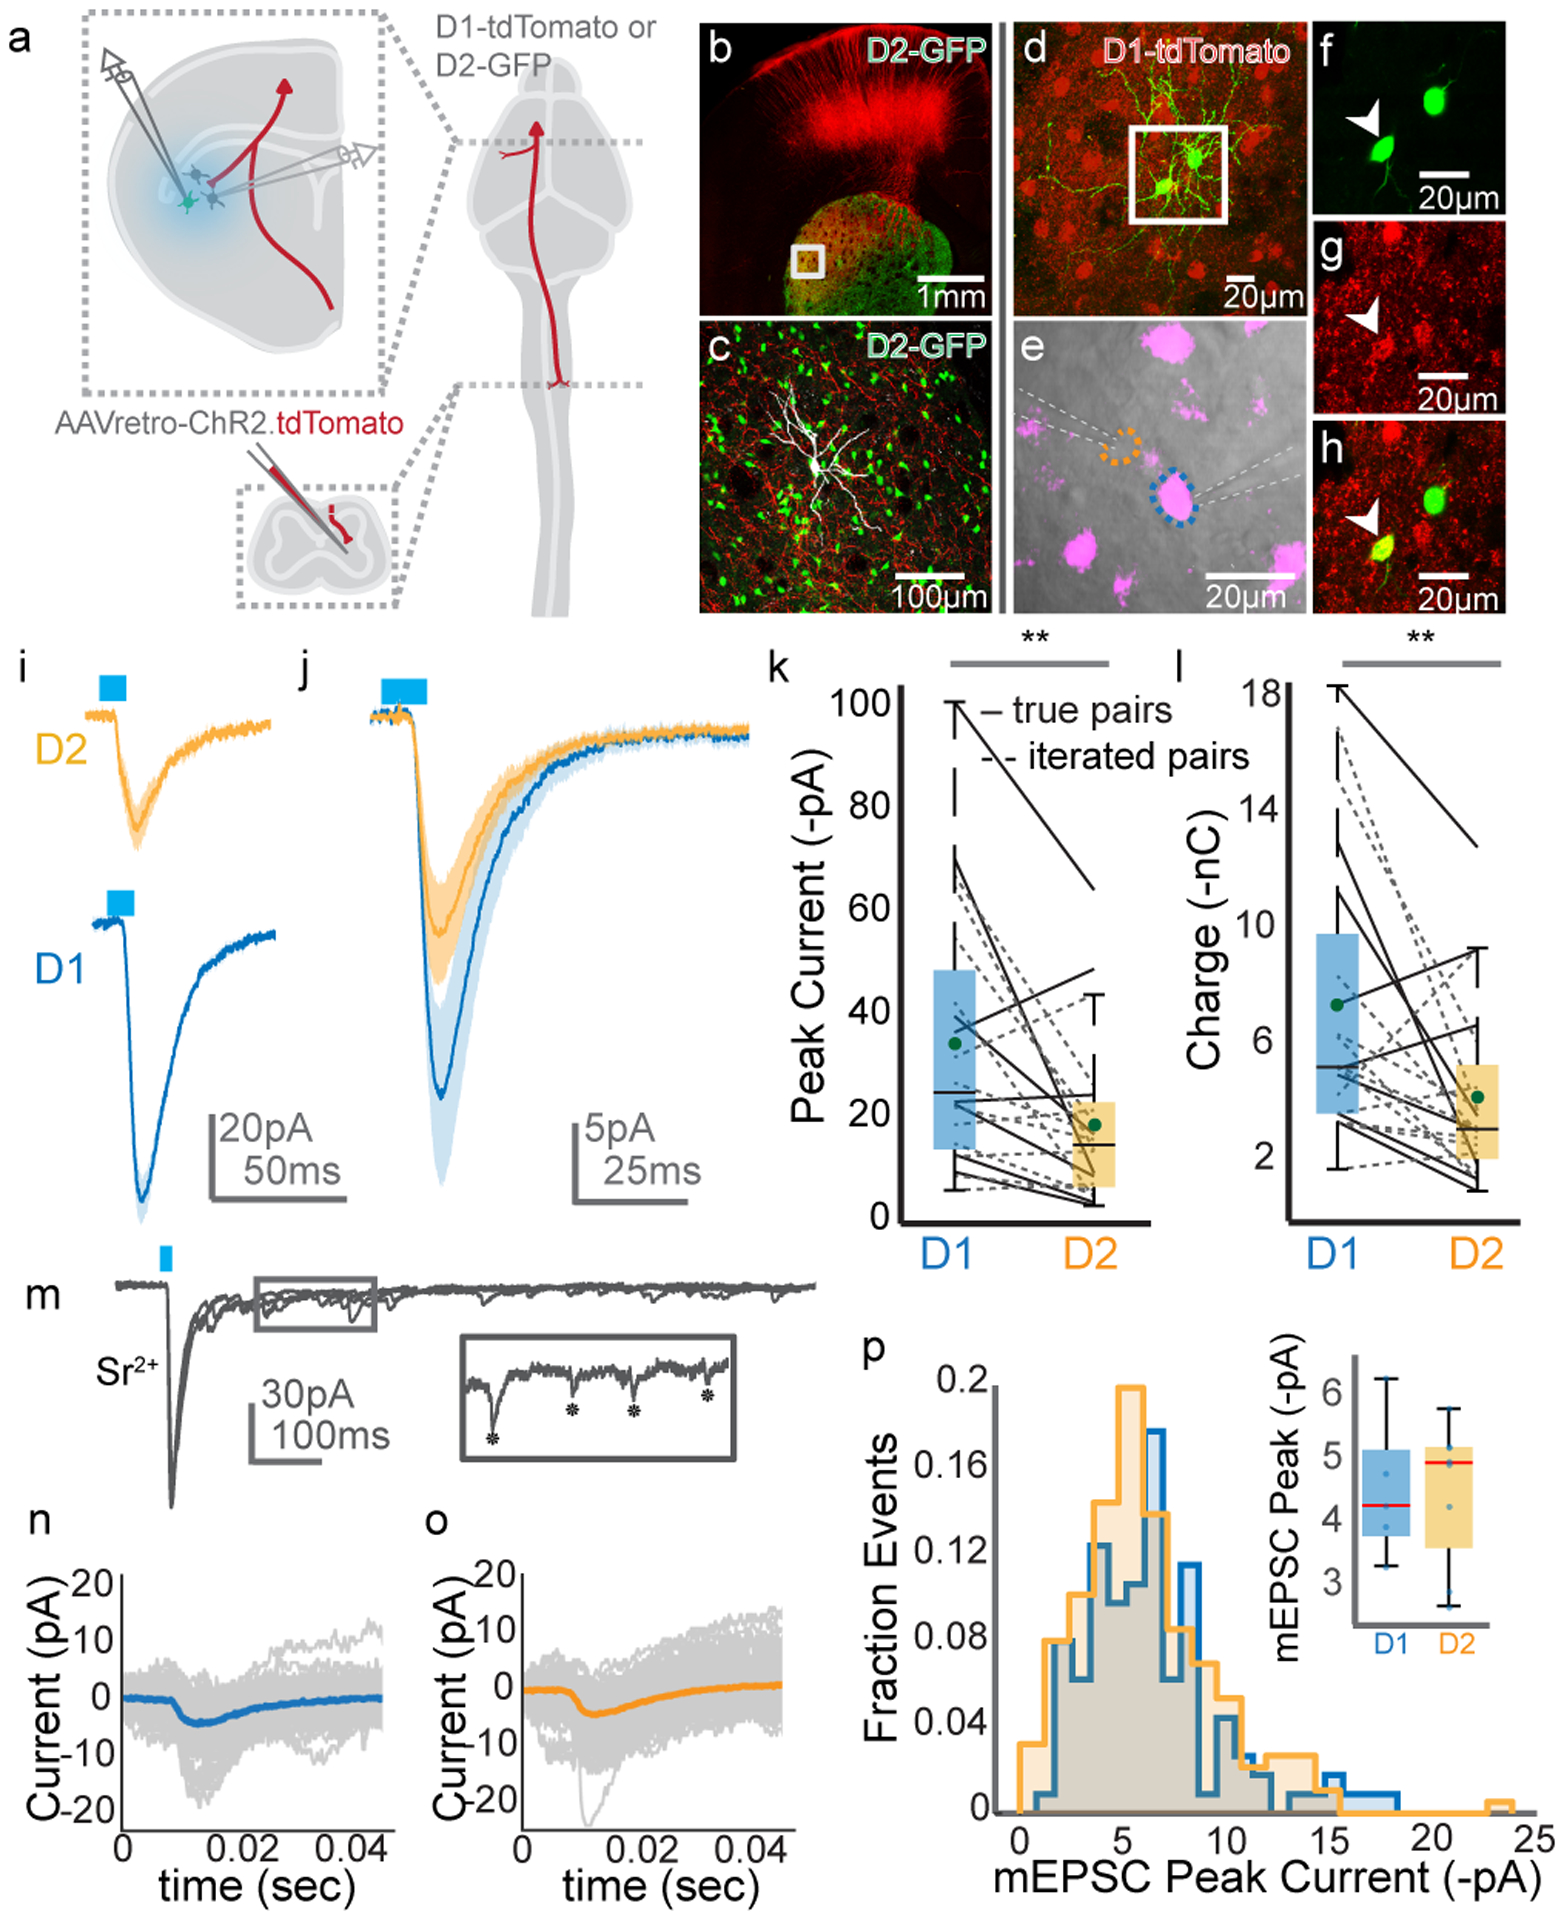
Figure 4. Optogenetics-assisted mapping of corticospinal collateral synapses in the striatum.

(A) Schematic of the experimental strategy. (B) Confocal micrograph of a brain slice, showing ChR2.tdTomato labeling (red) and D2 SPNs (green). (C) High magnification view of the boxed region from (B). An SPN targeted for recording and filled with neurobiotin is in grey. (D) Micrograph of two SPNs targeted for simultaneous recordings (green). D1 SPNs are in red. (E) DIC image of one D1 SPN (magenta, blue outline) and one D2 SPN (orange outline) targeted for simultaneous recording. Recording electrodes indicated with dashed white lines. (F-H) High magnification micrographs from (D) showing GFP (F), tdTomato (G), and overlay (H). The arrowhead indicates a D1 SPN. Micrographs from (B-H) are representative from N=6 experiments. (I) Recordings from a D1 SPN (blue) and D2 SPN (orange) in response to stimulation (blue bar) of ChR2-expressing axons. Holding potential is −70mV; shaded region indicates SEM. (J) Grand average response of all D1 (blue) and D2 (orange) SPNs to stimulation. Shaded area is SEM. (K-L) Pairwise comparison of ChR2-evoked amplitude (K) and charge (L) in D1 versus D2 SPNs, recorded simultaneously (solid lines) or in sequence (dashed lines). N=6, n=20, two-sided paired t-test, p=0.0037 for (K), p=0.006 for (L). (M) Voltage clamp recordings from an SPN following ChR2 stimulation with strontium replacing calcium. The inset shows single mEPSCs, indicated with asterisks. (N-O) Trial average of mEPSC evoked from an example D1 (N) and D2 (O) SPN. Individual trials are grey. (P) Distribution of all mEPSCs ordered by mEPSC peak current, recorded in D1 (blue) or D2 (orange) SPNs. The inset box-and-whisker plot compares average mEPSC amplitude in individual D1 versus D2 SPNs. N=5, n=5 for D1, n=8 for D2. The horizontal dashes in the box plots in (K), (L), and the inset for (P) represent the median. The greens dots in (K) and (L) indicate the means. The blue dots in the inset for (P) indicate peak mESPC amplitudes for individual neurons. The bottom and top edges of boxes indicate the 25th and 75th percentiles, while the whiskers indicate minima and maxima.
