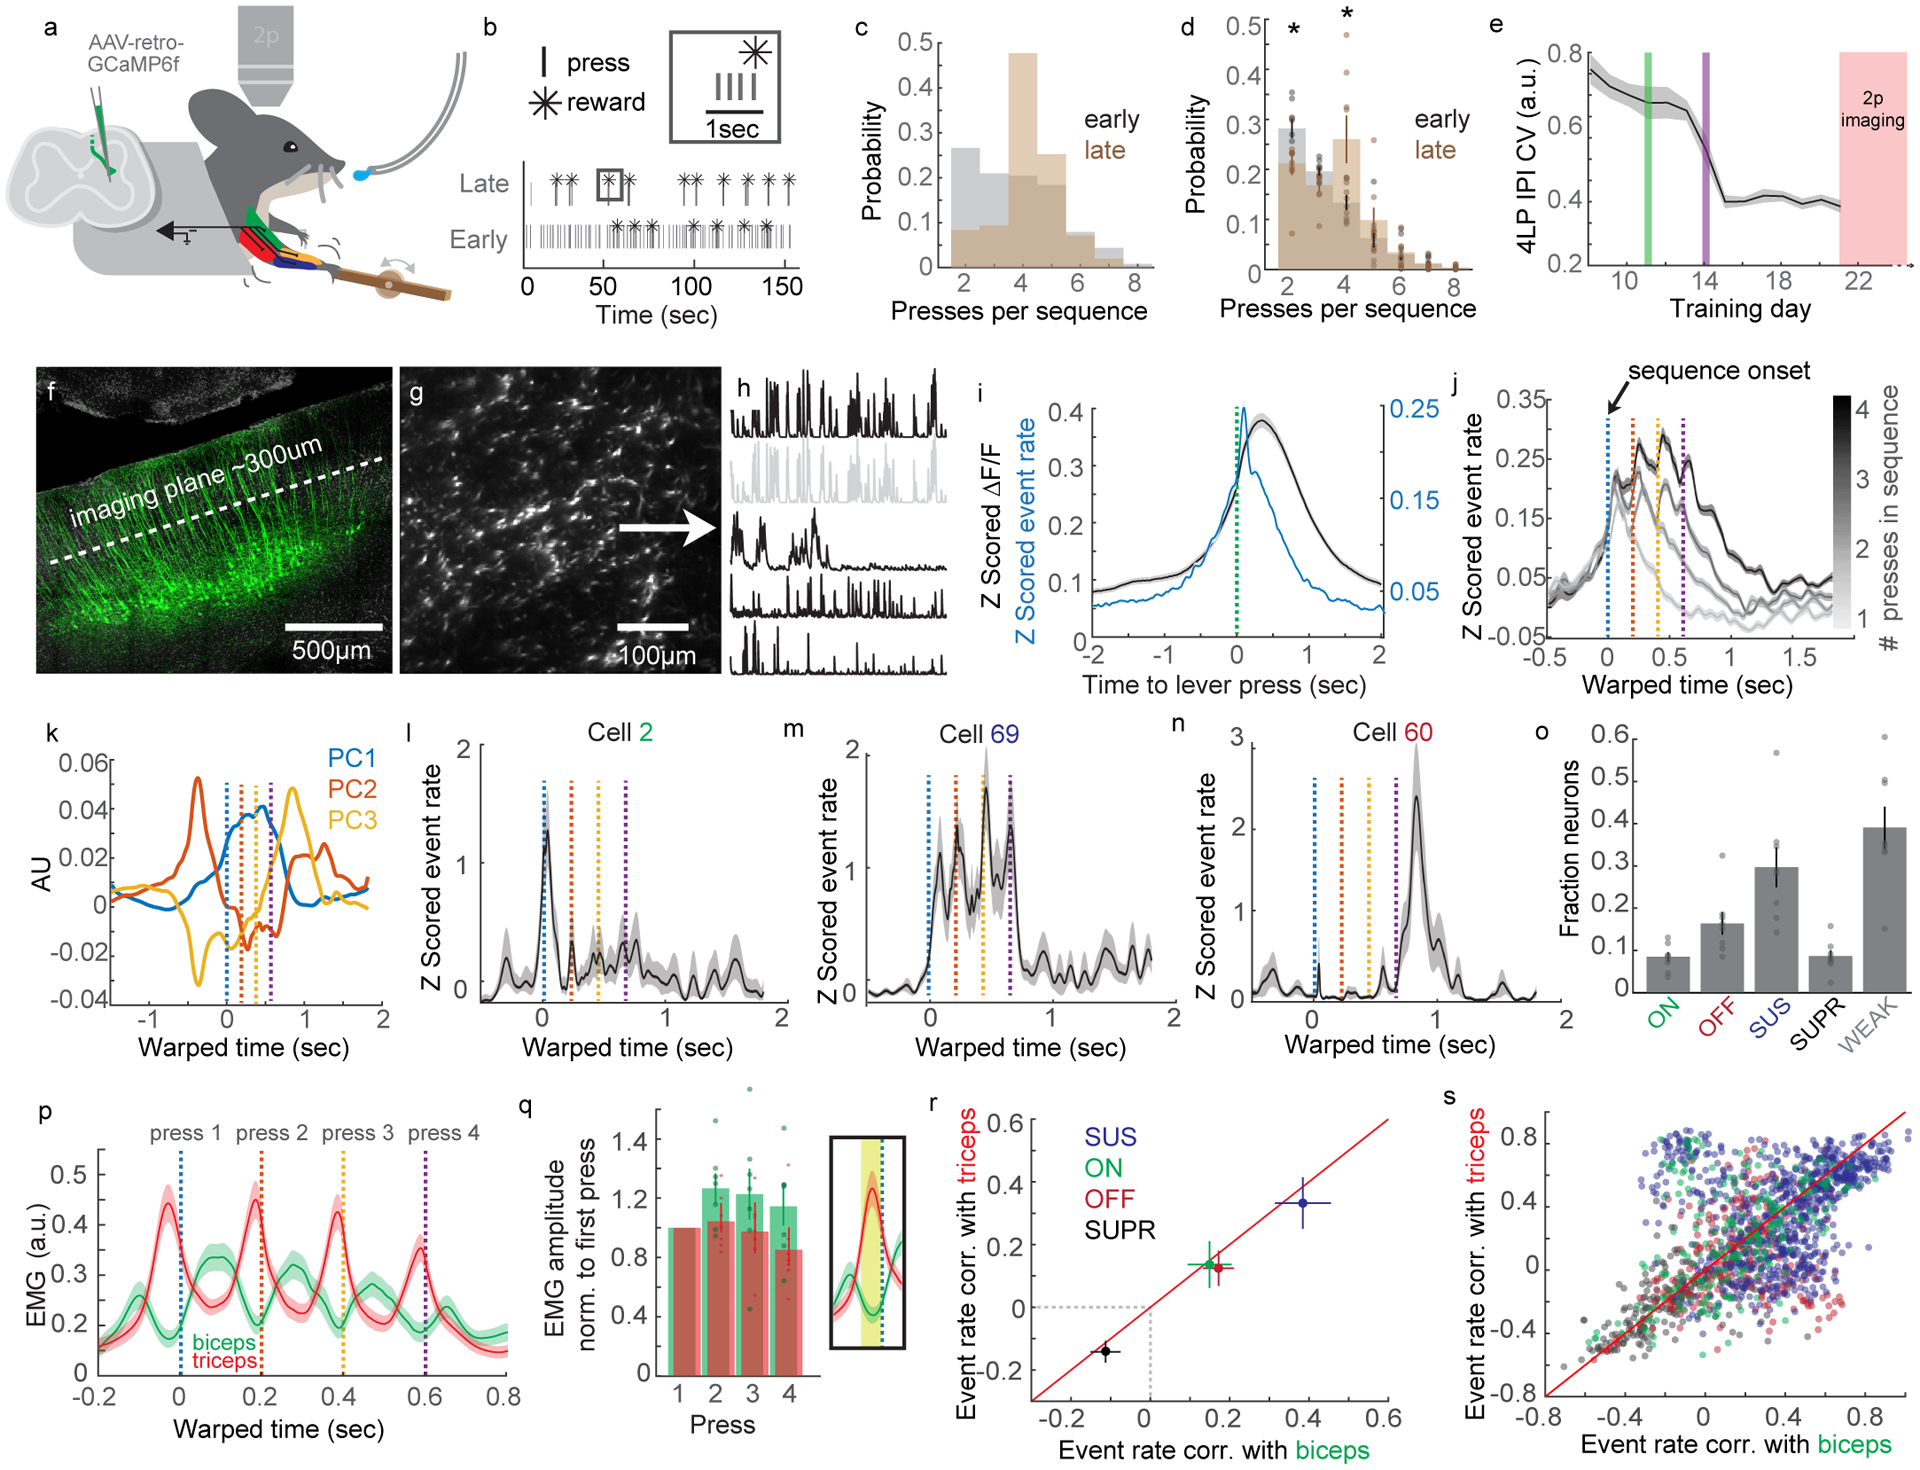
Figure 6. Two-photon calcium imaging of corticospinal neurons during a sequential forelimb behavior.

(A) Cartoon of behavior, 2p imaging, GCaMP6f labeling strategy, and EMG. (B) Example of lever press sequencing at training day 1 and day 7. (C) Probability of sequences containing different numbers of lever presses early (grey) and late in training (brown) from a single mouse. (D) Same as C, for all mice. Two-way ANOVA, F=84.77, d.f.=9, p=0, post hoc t-test, p=0.0284 and p=0.026, respectively, N=8. (E) Coefficient of variation of the inter-press interval (IPI) of four press sequences across training. The green vertical line indicates the day at which the maximum rewarded IPI is limited to 3 seconds. Before this, reward was issued every four presses, regardless of IPI. The purple line indicates when the IPI is limited to 2 seconds. (F) Micrograph of GCaMP6f-labeled CSNs, with the imaging plane indicated. DAPI is grey. (G) 2p image of GCaMP6f expression in dendrites of CSNs. (H) Calcium events derived using CNMF. The second trace is greyed out to indicate it is highly correlated to the top trace. (I) Average Z scored calcium (grey) and deconvolved events (blue) for all neurons and all mice aligned to single lever presses. n=2,374. (J) Average Z scored events aligned to the onset of lever press sequences, segregated by sequence length. IPIs are standardized using time warping; press times are indicated with colored dashed lines. n=2,374. (K) The top three PCs of time-warped activity. (L–N) Examples of neurons with activity coincident with the onset (L), individual presses (M), or offset (N) of lever press sequences. (O) The fraction of onset (ON), offset (OFF), sustained (SUS), suppressed (SUPR), or weak (WEAK) neurons, across all mice. (P) Time warped biceps and triceps EMG aligned to lever press sequences, for all mice. (Q) Quantification of the mean biceps and triceps activity preceding each press in a sequence. The inset indicates the time window for averaging activity. (R) Mean correlation of activity with biceps versus triceps EMG for ON, OFF, SUS, or SUPR neurons. (S) Same as (R), but showing the individual neuron correlations with biceps versus triceps. N=8 for all analyses. Error bars are SEM. Shaded areas are SEM.
