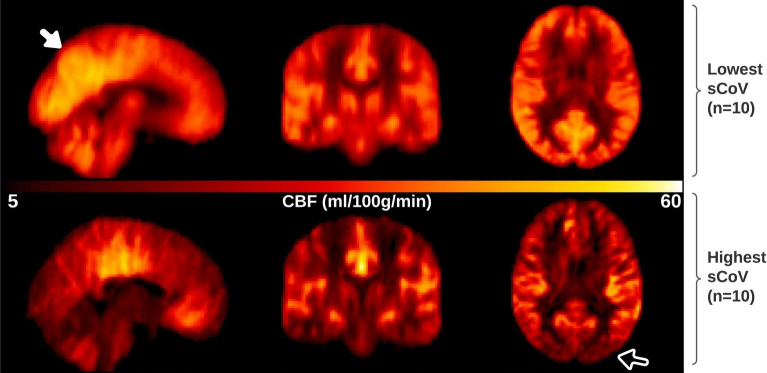
Figure 1.
Illustrative figure depicting the appearance of CBF maps with low versus high sCoV in sagittal (left) coronal (middle) and axial (right) orientations. Top row, average non-PVC CBF maps for 10 participants with the lowest sCoV in GM ROI from the total cohort studied. This averaged CBF map representing low sCoV appears as expected, with high grey-white matter contrast, and increased perfusion in the region of the posterior cingulate cortex (PCC) and precuneus (see filled arrow). Bottom row, average non-PVC CBF maps for 10 participants with the highest sCoV in GM. The averaged CBF map for highest sCoV shows lower cortical perfusion overall, most notably in the posterior vascular territory (see open arrow), suggesting too short post labelling delay (PLD)/prolonged ATT.

