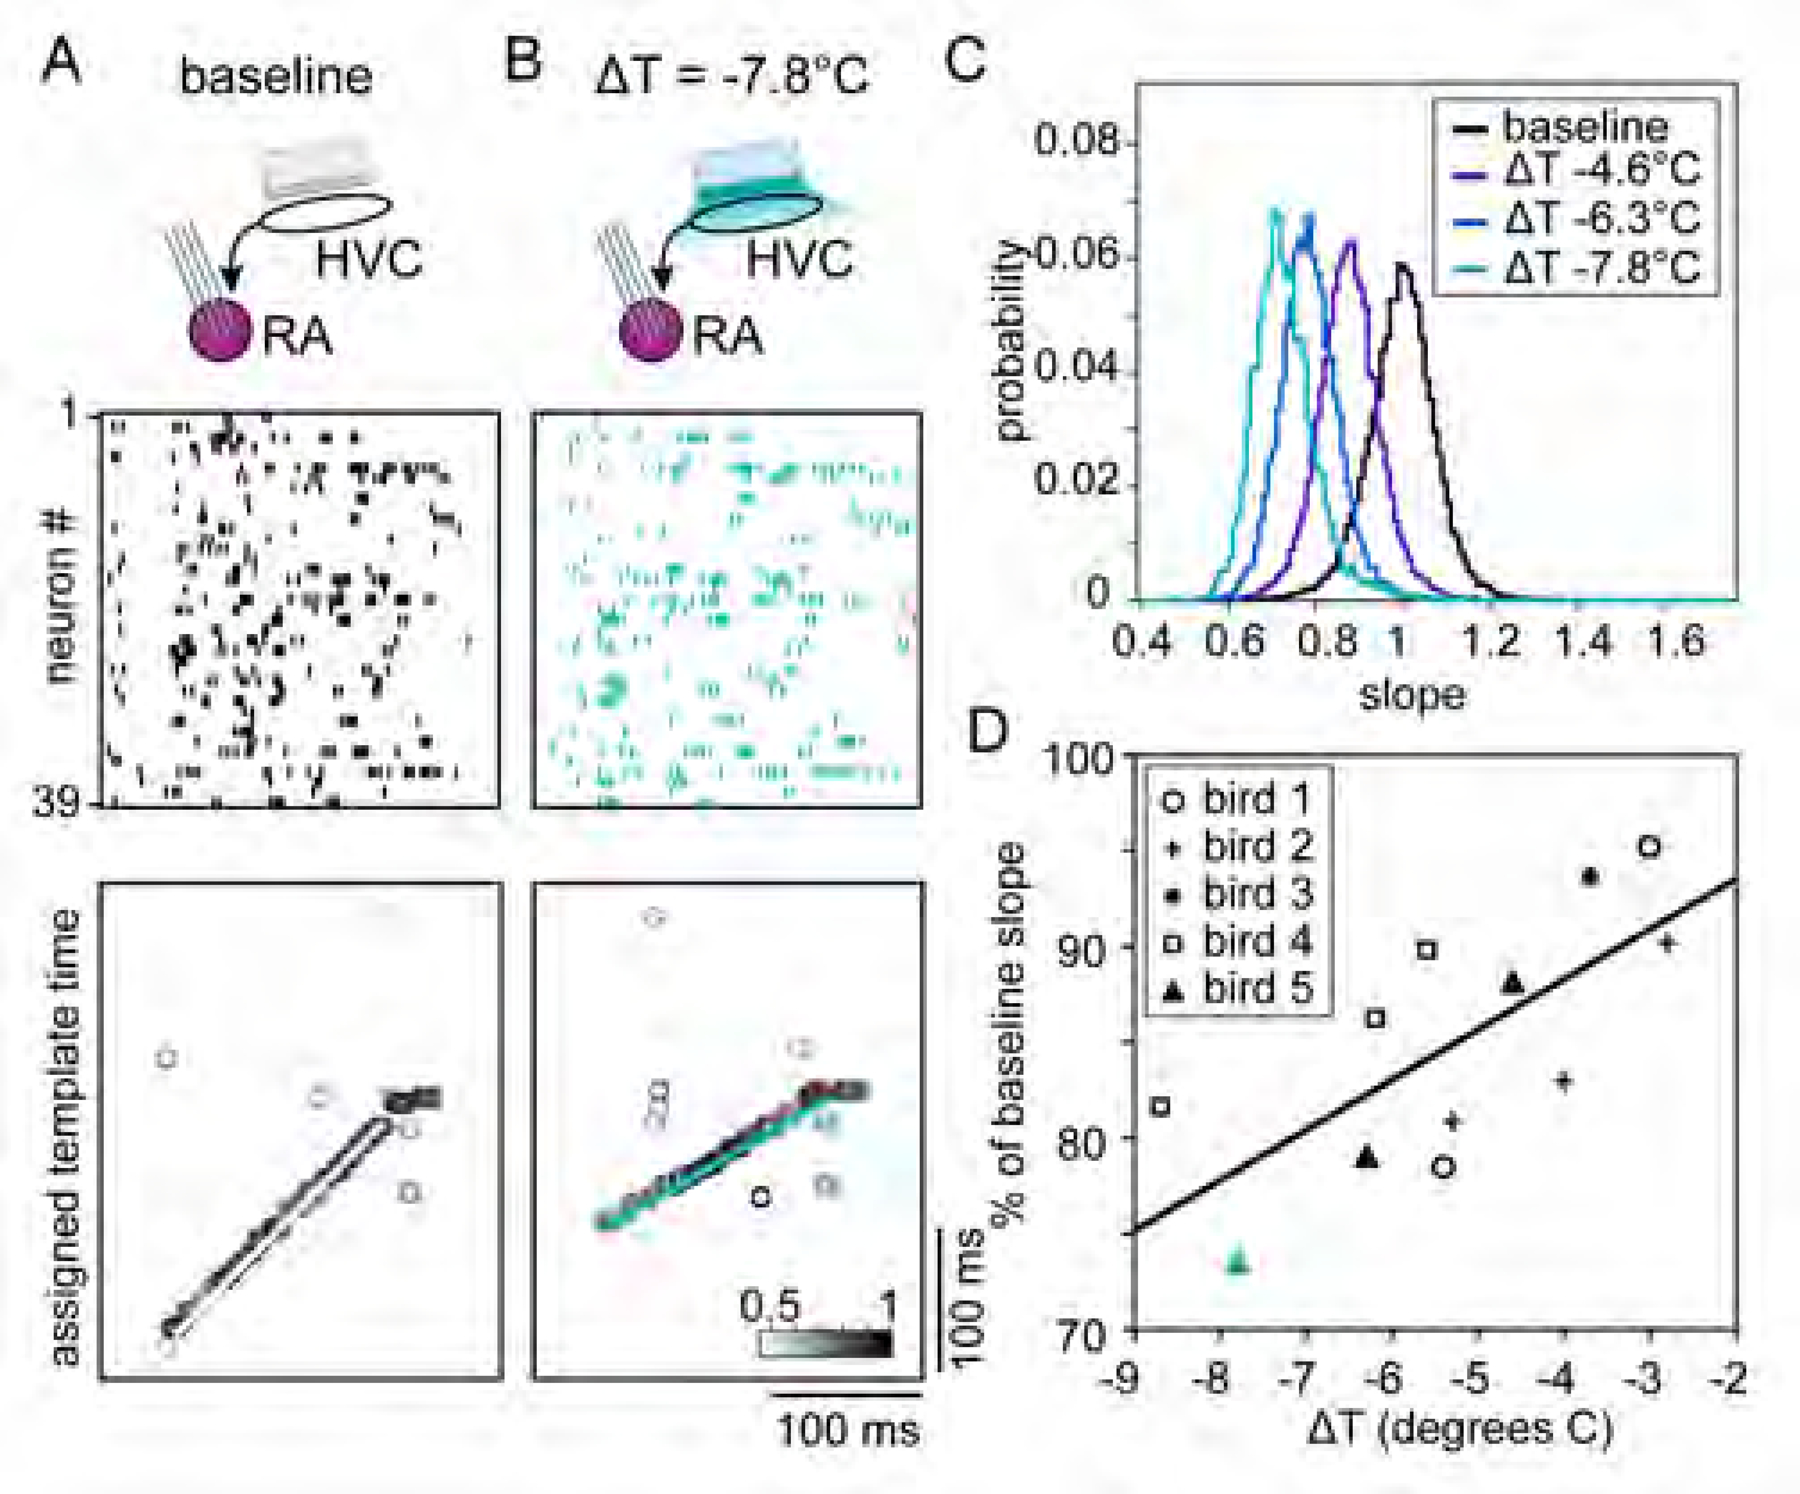
Figure 4. Focal HVC cooling slows sleep replay events in RA.

(A and B) (Top) Schematic of experiment, with silicon probes in RA and a Peltier device on the surface of HVC. Spiking activity (middle) and template matching results (bottom) for 39 simultaneously recorded RA neurons in the baseline (A) and cooled (B) conditions. Detected example events for baseline and cooled conditions shown in white (A) and teal (B), respectively.
(C) Distribution of slopes for each temperature condition in Bird 5 normalized to the mean baseline (ΔT = 0°C) slope.
(D) Population data for all birds (n = 5); each data point indicates the mean slope relative to baseline for a given condition in a single bird. Teal triangle is maximum cooling condition from (C) (ΔT = −7.8°C). Best fit line: slope = 2.6%/°C; R2 = 0.51.
See also Figure S4.
