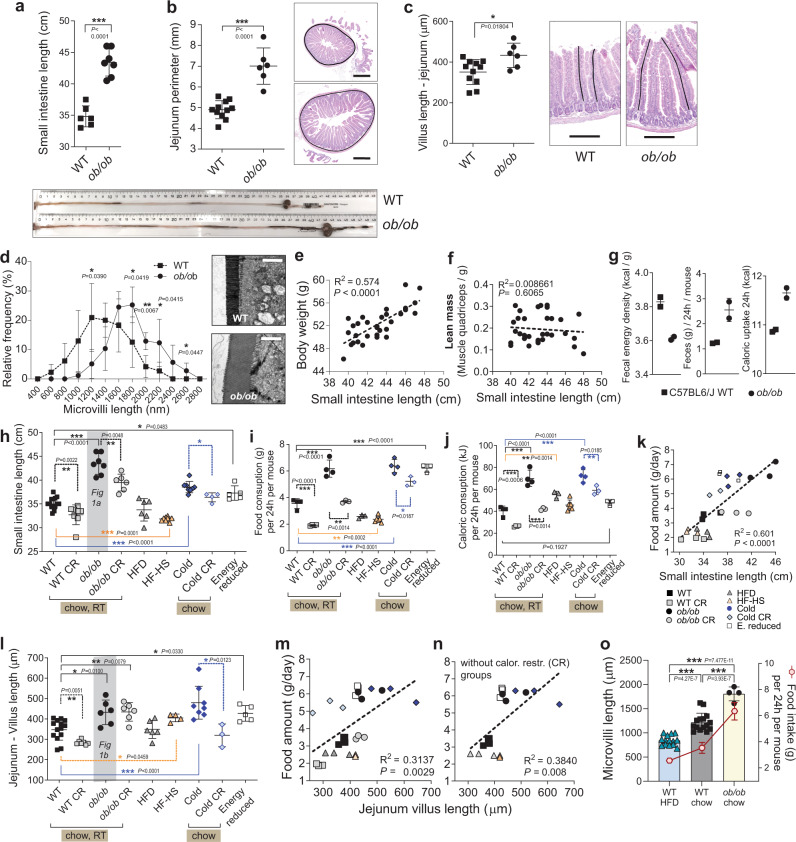
Fig. 1. Food amount regulates the intestinal absorptive surface at multiple levels.
a–d Small intestinal length (n = 6 WT, n = 7 ob/ob), repeated in five independent experiments with similar results, and the representative gut images (a), perimeter of jejuna (average from n = 11 WT, n = 6 ob/ob) and representative haematoxylin and eosin (H&E) images with perimeter tracing, scale bar: 500 μm (b), average lengths of villi in jejuna (average from n = 11 WT, n = 6 ob/ob) with the examples of a villus length measurement on H&E staining, scale bar: 200 μm (c), distribution of microvilli lengths (from WT n = 5 mice, ob/ob n = 4 mice) measured along the middle part of villi in proximal jejuna, with the representative electron micrographs, scale bar = 2000 nm (d) of ob/ob and WT C57BL6/J male mice, 14 week-old. e, f Linear regression of body weights and small intestinal lengths (e) and their lean mass (represented by the weight of the quadriceps muscle) vs. intestinal length (f) of ob/ob mice pooled from multiple experiments, age 12–14 weeks, n = 33 male mice. g Caloric density of faecal samples (left), daily faecal output (centre), and total caloric uptake (right, calories from food – excreted calories) in 24 h (right) from WT and ob/ob mice, two samples per condition, where each sample is a 24 h faeces collected from a single cage with three mice. h–n Small intestine length (h), daily food intake (i), daily caloric consumption (j), linear regression of average food intake and intestinal length (k), average villi length in jejuna (l), linear regression of villi length in jejuna and food intake with (m) or without (n) calorically restricted groups of male mice under different dietary regimes, 14 week-old, C57BL/6 J background, SPF facility. Abbreviation of the treatments: CR caloric restriction (60% of ad libitum) for six weeks (WT, ob/ob groups) or 10 days (cold), HFD high-fat diet, HF-HS high-fat high-sucrose diet, RT room temperature (23 °C), Cold 6 °C for 30 days, Energy reduced ad libitum feeding on diet with the low caloric density for 30 days. For i-n the WT group is pooled from all the respective experiments (o), Mean lengths of microvilli from middle part of jejuna of WT mice fed HFD (n = 14 mice) or standard chow (n = 15), and of ob/ob mice (n = 4) and their average food intake. Shaded data in (h) and (l) are repeated data from (a) and (b). For (h), n = 14 (WT), eight (WT CR), seven (ob/ob), six (ob/ob CR), six (HFD), eight (HFHS), 8 (Cold), four (Cold CR) mice. For l, n = 14 (WT), seven (WT CR), six (ob/ob, ob/ob, HFD), four (HFHS), eight (Cold), three (Cold CR), five (ER) mice. For (i), (j), n = 4 cages (WT, WT CR, ob/ob, Cold), n = 3 (ob/ob CR, HFD, Cold CR, Energy reduced), n = 6 cages (HF-HS). For (k), (m), (n), n = 3 per group, where each dot represents average intestinal or villus length and food intake in a single cage. All data represent mean ± S.D. Statistical tests: for (h), (i), (j), l one-way ANOVA, Dunnet’s post-hoc correction for multiple comparisons (all groups compared to WT), the alpha 0.05 (solid lines), or two-sided t-test (dashed lines); for (k), (m), (n) linear regression, confidence level 95%; for all other panels unpaired two-sided t-test, confidence level 95%. *P ≤ 0.05, **P < 0.01, ***P < 0.001. Source data are provided as a Source Data file.

