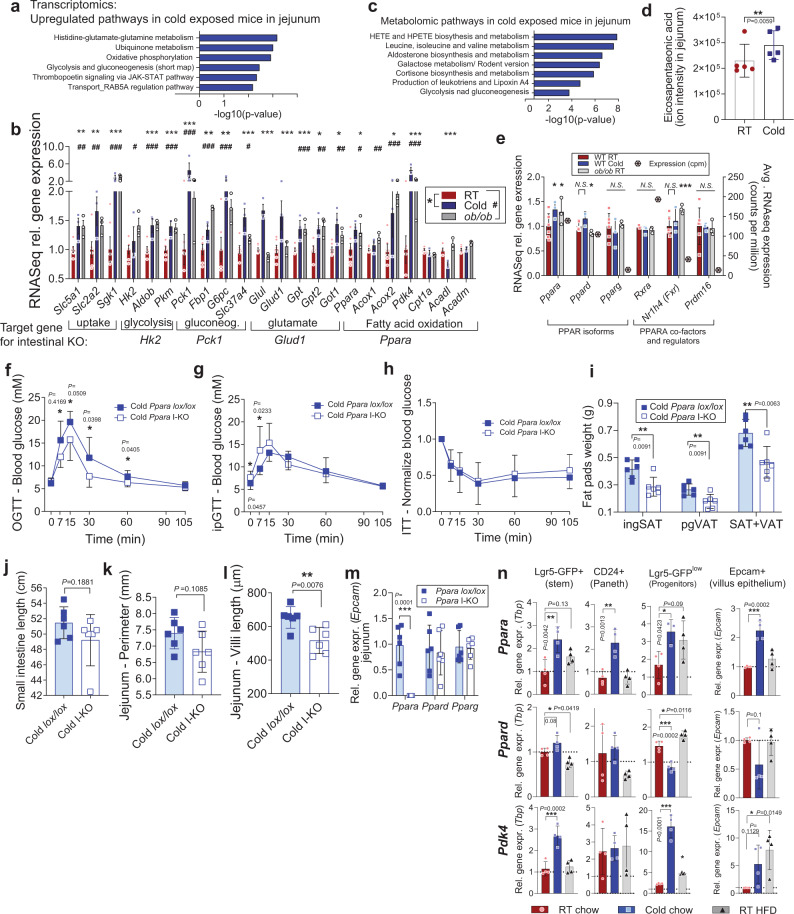
Fig. 2. Energy harvesting pathways are upregulated in enlarged intestines of overeating mice, among which Ppara is necessary for villi elongation.
a RNASeq pathway analysis by MetaCore upregulated pathways in jejuna of 30-day cold-exposed WT mice (Cold) compared to room temperature (RT) mice, n = 3 sample per group, each sample is a pool of two biological replicates. b Relative RNASeq expression of metabolic genes in RT and Cold mice as in a, and in male ob/ob mice, n = 3 per group, where each sample is a pool of two proximal jejuna. RT n = 3 vs. Cold n = 3 (*), and WT n = 3 vs. ob/ob n = 3 (#) comparisons are from separate experiments, Counts normalized and RT and WT pooled together in the figure. c Enriched metabolomic pathways in Cold mice jejuna (the whole tissue lysate), for metabolite fold-change P < 0.05, as implemented in MetaCore, n = 5 mice per group. d Relative concentration of eicosapentaenoic acid in jejuna of RT and Cold mice, n = 5 per group (P = 0.00594, z-scores of the replicates with a z-test, uncorrected for multiple comparison). e RNASeq expression of PPAR-related genes in RT, Cold and ob/ob mice as in (b), together with the average count per million in the RT mice, * and # as in (b). f–m oral glucose tolerance test (f), intraperitoneal GTT (g), insulin tolerance test (h), white adipose tissue pads (ingSAT inguinal subcutaneous adipose tissue, pgVAT perigonadal visceral) (i), small intestinal length (j), average perimeter of jejunum (k) and average villi length in jejunum (j) of 30-days cold-exposed Ppara lox/lox and Ppara I-KO male mice, 16 week-old, n = 6 mice per group. m Gene expression by qPCR of Ppar isoforms in jejunum tissue of mice from (f–m). n Gene expression by qPCR of Ppara, Ppard, and PPAR target Pdk4 in FACS-sorted jejunal cells from Lgr5-EGFP mice exposed two weeks to cold (6 °C) or HFD on RT, from n = 4 mice per group. Levels are normalized to Tbp, and to room temperature stem cell values (for crypt cell types). All data represent mean ± S.D. *P ≤ 0.05, **P < 0.01, ***P < 0.001 of unpaired two-sided t-test, confidence level 95%, except for (b) and (e), were P values for RNASeq data were calculated using general linear model with negative binomial distribution, no correction for multiple comparison, for (d), z-scores, and for (m), one-way ANOVA, Dunnet’s post-hoc correction for multiple comparison, alpha 0.05. Source data are provided as a Source Data file, including exact P values for panels (b) and (e).

