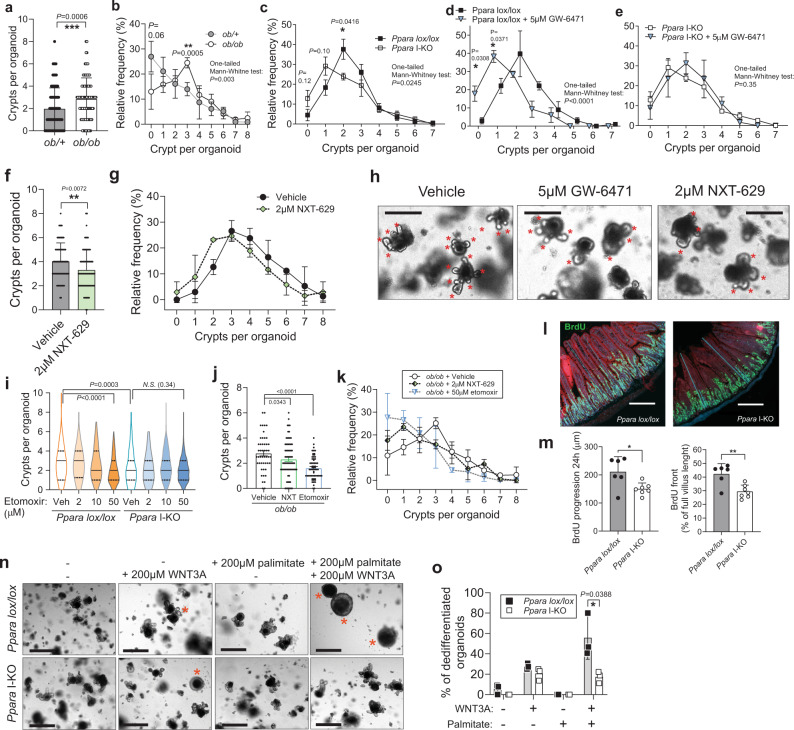
Fig. 4. Organoid crypt budding is decreased by PPARα knock-out and inhibition.
a Number of crypts per organoid in the organoid cultures derived from two ob/+ and two ob/ob mice on chow diet. 120 ob/+ and 88 ob/ob organoids were analysed from 3 wells per group, at day 5, one-tail Mann–Whitney test. b Histogram of (a) n = 3 wells per group. c Histogram of organoid distribution according to the number of crypts in the cultures from Ppara lox/lox and I-KO mice on chow diet, cultured without inhibitors, pool from two independent experiments and 6 (lox/lox) or 5 (I-KO) wells per group, total of 282 (lox/lox) or 220 (I-KO) organoids. One-tail Mann–Whitney tests on the histograms refer to the comparison of all organoids between the two groups (as in a), and asterisks for difference (two-tailed t-test) between frequencies of distribution on the histograms. d, e Histogram of organoid distribution by the number of crypts in the cultures from Ppara lox/lox, n = 3 wells per group (d) or Ppara I-KO mice (n = 5 wells for DMSO, n = 3 for GW-6471) (e), treated daily with DMSO or 5 μM GW-6471, on day 7. f Number of crypts per organoid, on day 9 of daily incubation with 2 μM NXT-629 and its vehicle, from two mice per group, 72 (vehicle) and 69 (NXT-629) organoids analysed, one-tail Mann–Whitney test. g Histogram of (f). h Representative images of organoid cultures from (d) and (f) on day 9, red asterisks mark crypt outgrowth, scale bar is 200 μm. i Violin plot of distribution of organoids per number of crypts in Ppara lox/lox and Ppara I-KO organoids when incubated with etomoxir, pooled from three wells per group on day 5 in a single experiment, median marked with solid, quartiles with dashed lines. Number of organoid, lox/lox: 251 (vehicle), 84 (2 μM), 169 (10 μM), 162 (50 μM), I-KO: 193 (veh.), 87 (2 μM), 270 (10 μM), 202 (50 μM) j, Number of crypts per organoid from ob/ob mice as in (a), on day 5 of daily incubation with a vehicle or 2 μM NXT-629, n = 88 (veh.), 127 (NXT), n = 201 (etomoxir). k Histogram of (j). l, m BrdU staining of jejunum 24 h after injection, with villi counterstained with Evans blue, and thin blue lines indicated measurements of villi and BrdU progression, scale bar is 200μm (l), BrdU progression along the villi in μm, and as a percentage of villus length (m), n = 6 (lox/lox), 7 (I-KO) mice per group. n Addition of WNT3A to basal ENR medium (EGF, Noggin, R-spondin) induces cystic crypts and organoids (red asterisks), potentiated by addition of palmitate, scale bar is 500μm. o Percentage of spherical organoids in the well, n = 3 per group, day 7. All data represent mean ± S.D, (except for I, as described) *P ≤ 0.05, **P < 0.01, ***P < 0.001 of unpaired two-sided t-test, confidence level 95%, except for (a, f, and i), where it stands for one-tail Mann–Whitney non-parametric test. Source data are provided as a Source Data file.

