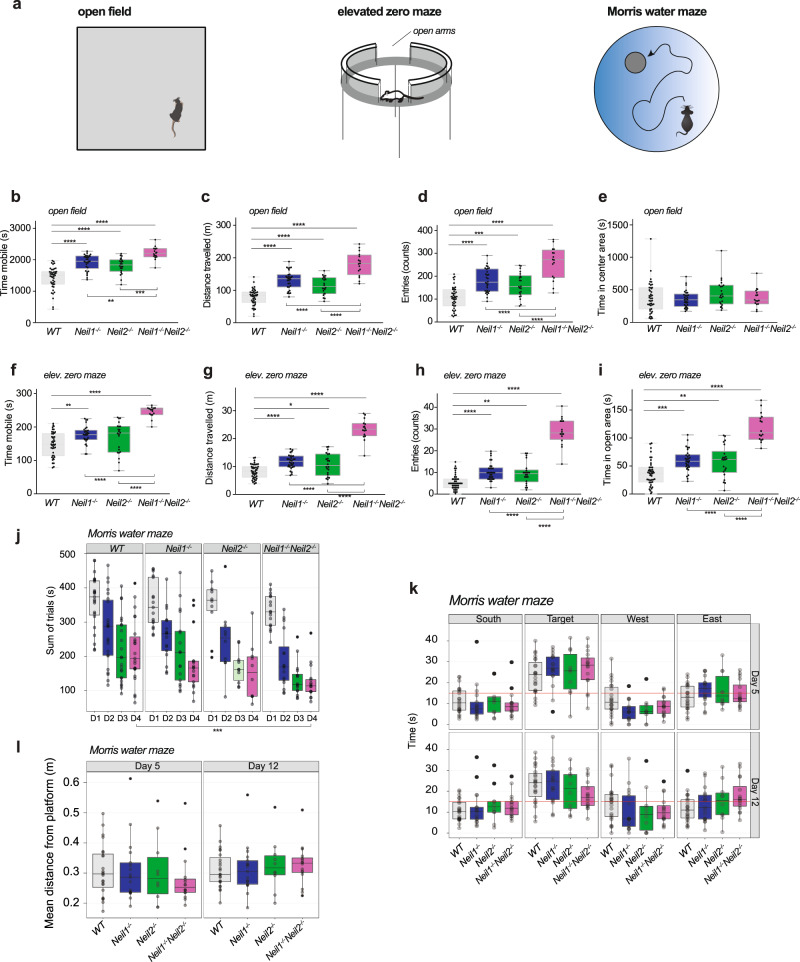
Fig. 1. Increased activity, reduced anxiety and enhanced learning in Neil1−/−Neil2−/− mice.
a Schematics of behavioral tests. b–e In the open field maze mice were allowed to explore freely for 45 min in an arena measuring L40 cm x W40 cm x H35 cm. An area of L20 cm x W20 cm was defined as the center area zone. b Time mobile, c distance travelled, d entries to the center area zone, and e time in the center area zone. f–i In the elevated zero maze, the mice were allowed 5 min for exploration on a 5-cm wide circular runway with alternating open and closed areas. f Time mobile, g distance travelled, h entries to the open area zones, and i time in the open area zones. b–i Data are shown in full, with overlaid boxplots representing the medians and the interquartile ranges (IQR). Whiskers indicate min/max values. Individual mice are represented by black dots. n = 43 WT, 30 Neil1−/−, 22 Neil2−/− and 16 Neil1−/−Neil2−/− mice. *P < 0.05, **P * p < 0.01, ***P < 0.001, ****P < 0.0001 by one-way ANOVA/Tukey. j–l In the Morris water maze, mice were trained to locate an escape platform hidden below the water surface (days 1–4) before memory was tested (days 5 and 12). j Latency to locate the platform and escape the water during learning trials, days 1 to 4. The data are shown as the total time spent in the tank for each mouse during eight trials. ***P = 0.00019 for Neil1−/−Neil2−/− vs. WT by non-parametric pair wise Wilcoxon rank-sum test, Holm-adjusted. k Time spent in the four quadrants of the tank (the red line indicates average level expected by random behavior) and l mean distance from the platform zone during retention trials (probe tests), days 5 and 12. j–l Data are shown in full, with overlaid boxplots representing the medians and the interquartile ranges (IQR). Whiskers extend to a Tukey fence set at 1.5xIQR. Each mouse is indicated by a round symbol, outliers in black and all others in grey (different shades of grey indicate overlapping mice/symbols). n = 22 WT, 17 Neil1−/−, 10 Neil2−/− and 16 Neil1−/−Neil2−/− mice.

