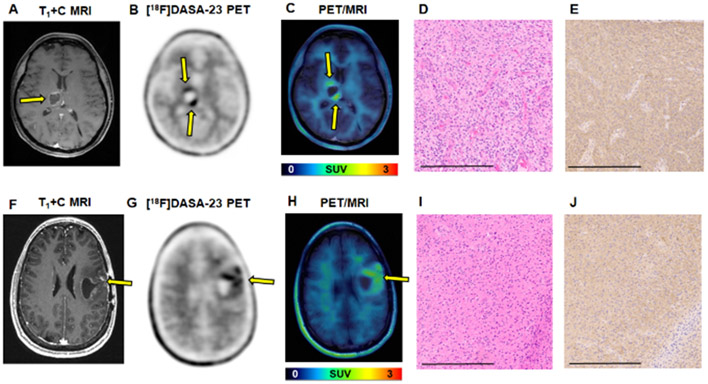
Figure 6.
Evaluation of [18F]DASA-23 in patients IC-3 ((WHO Grade IV diffuse midline glioma, H3 K27M-mutant) and IC-4 (WHO grade III recurrent anaplastic astrocytoma). A Representative contrast-enhanced T1-weighted MRI of IC-3 shown in the axial plane. B Representative 30-60 min summed [18F]DASA-23 PET shows two focal areas of tracer uptake in IC-3. C Fused 30-60 min summed [18F]DASA-23 PET/MRI in IC-3. Yellow arrows indicate the location of the tumor. H&E D and PKM2 IHC E of the biopsied tissue confirm the expression of PKM2 within the malignant cells, images are shown at 10× and scale bar represents 300 μm. F Representative contrast-enhanced T1-weighted MRI of IC-4 shown in the axial plane. G Representative 30-60 min summed [18F]DASA-23 PET shows heterogeneous tracer uptake in IC-4. H Fused 30-60 min summed [18F]DASA-23 PET/MRI in IC-4. Yellow arrows indicate the location of the tumor. H&E I and PKM2 IHC J of the resected tumor confirm the expression of PKM2 within the malignant cells, images are shown at 10× and scale bar represents 300 μm.

