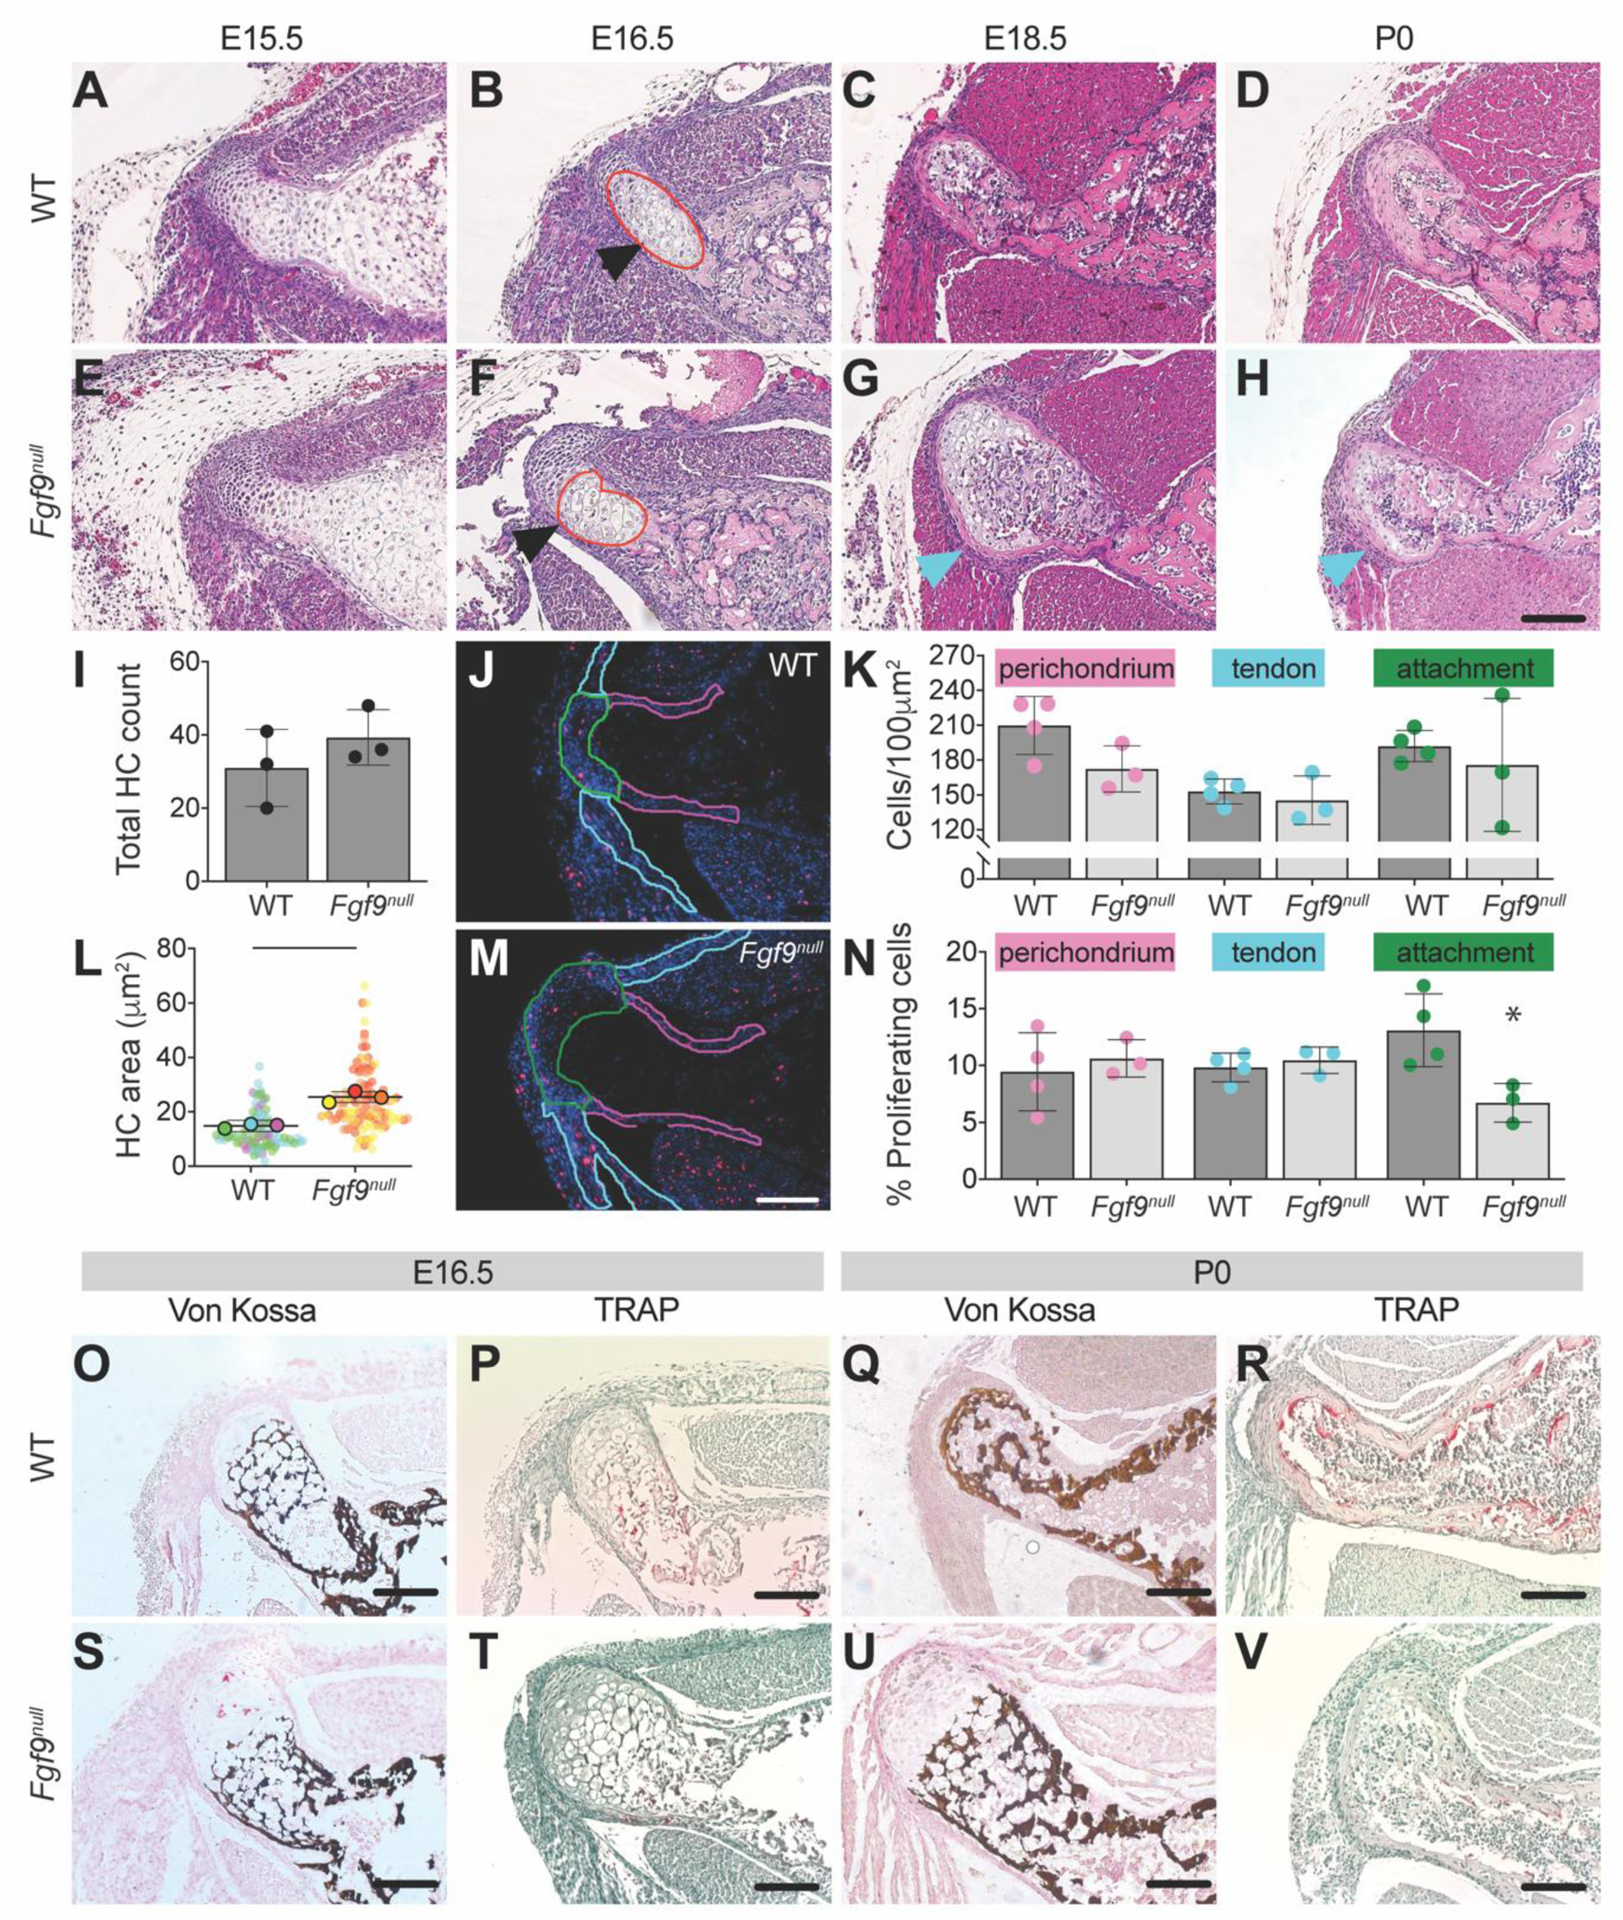
Figure 3: The DTs of Fgf9null embryos undergo differences in cellular and morphological development when compared to WT embryos.

The DT of Fgf9null embryos was larger than the DT of WT embryos as early as E16.5 (black arrows; scale bar = 100μm). During later stages of development (E18.5 (C, G) and P0 (D, H)), hypertrophic chondrocytes (blue arrows) remained in the DT of Fgf9null embryonic limb and were absent in WT embryonic limb. H&E-stained transverse sections of the DT in (B) WT embryos and (F) Fgf9null embryos at E16.5. Red lines represent the region of hypertrophic chondrocytes. Fgf9null embryos had a (I) similar number of hypertrophic chondrocytes and (L) larger average area of hypertrophic chondrocytes compared to WT embryos. (J,M) Proliferating cells were labeled at E16.5 using EdU, in red. Outlined regions of interest include the perichondrium (pink), tendon (teal), and attachment (green). Fgf9null embryos had (K) similar cell density and (N) reduced proliferation rates at the DT attachment compared to WT embryos at E16.5. (U) At P0 Fgf9null neonates had abnormal mineral patterning (von Kossa) and (V) fewer osteoclasts (TRAP) than (Q,R) WT neonates (scale = 100μm). Data are biological replicates (faded circles are technical replicates), mean ± SD. Lines in L and * in N indicates significant difference between groups (p < 0.05).
