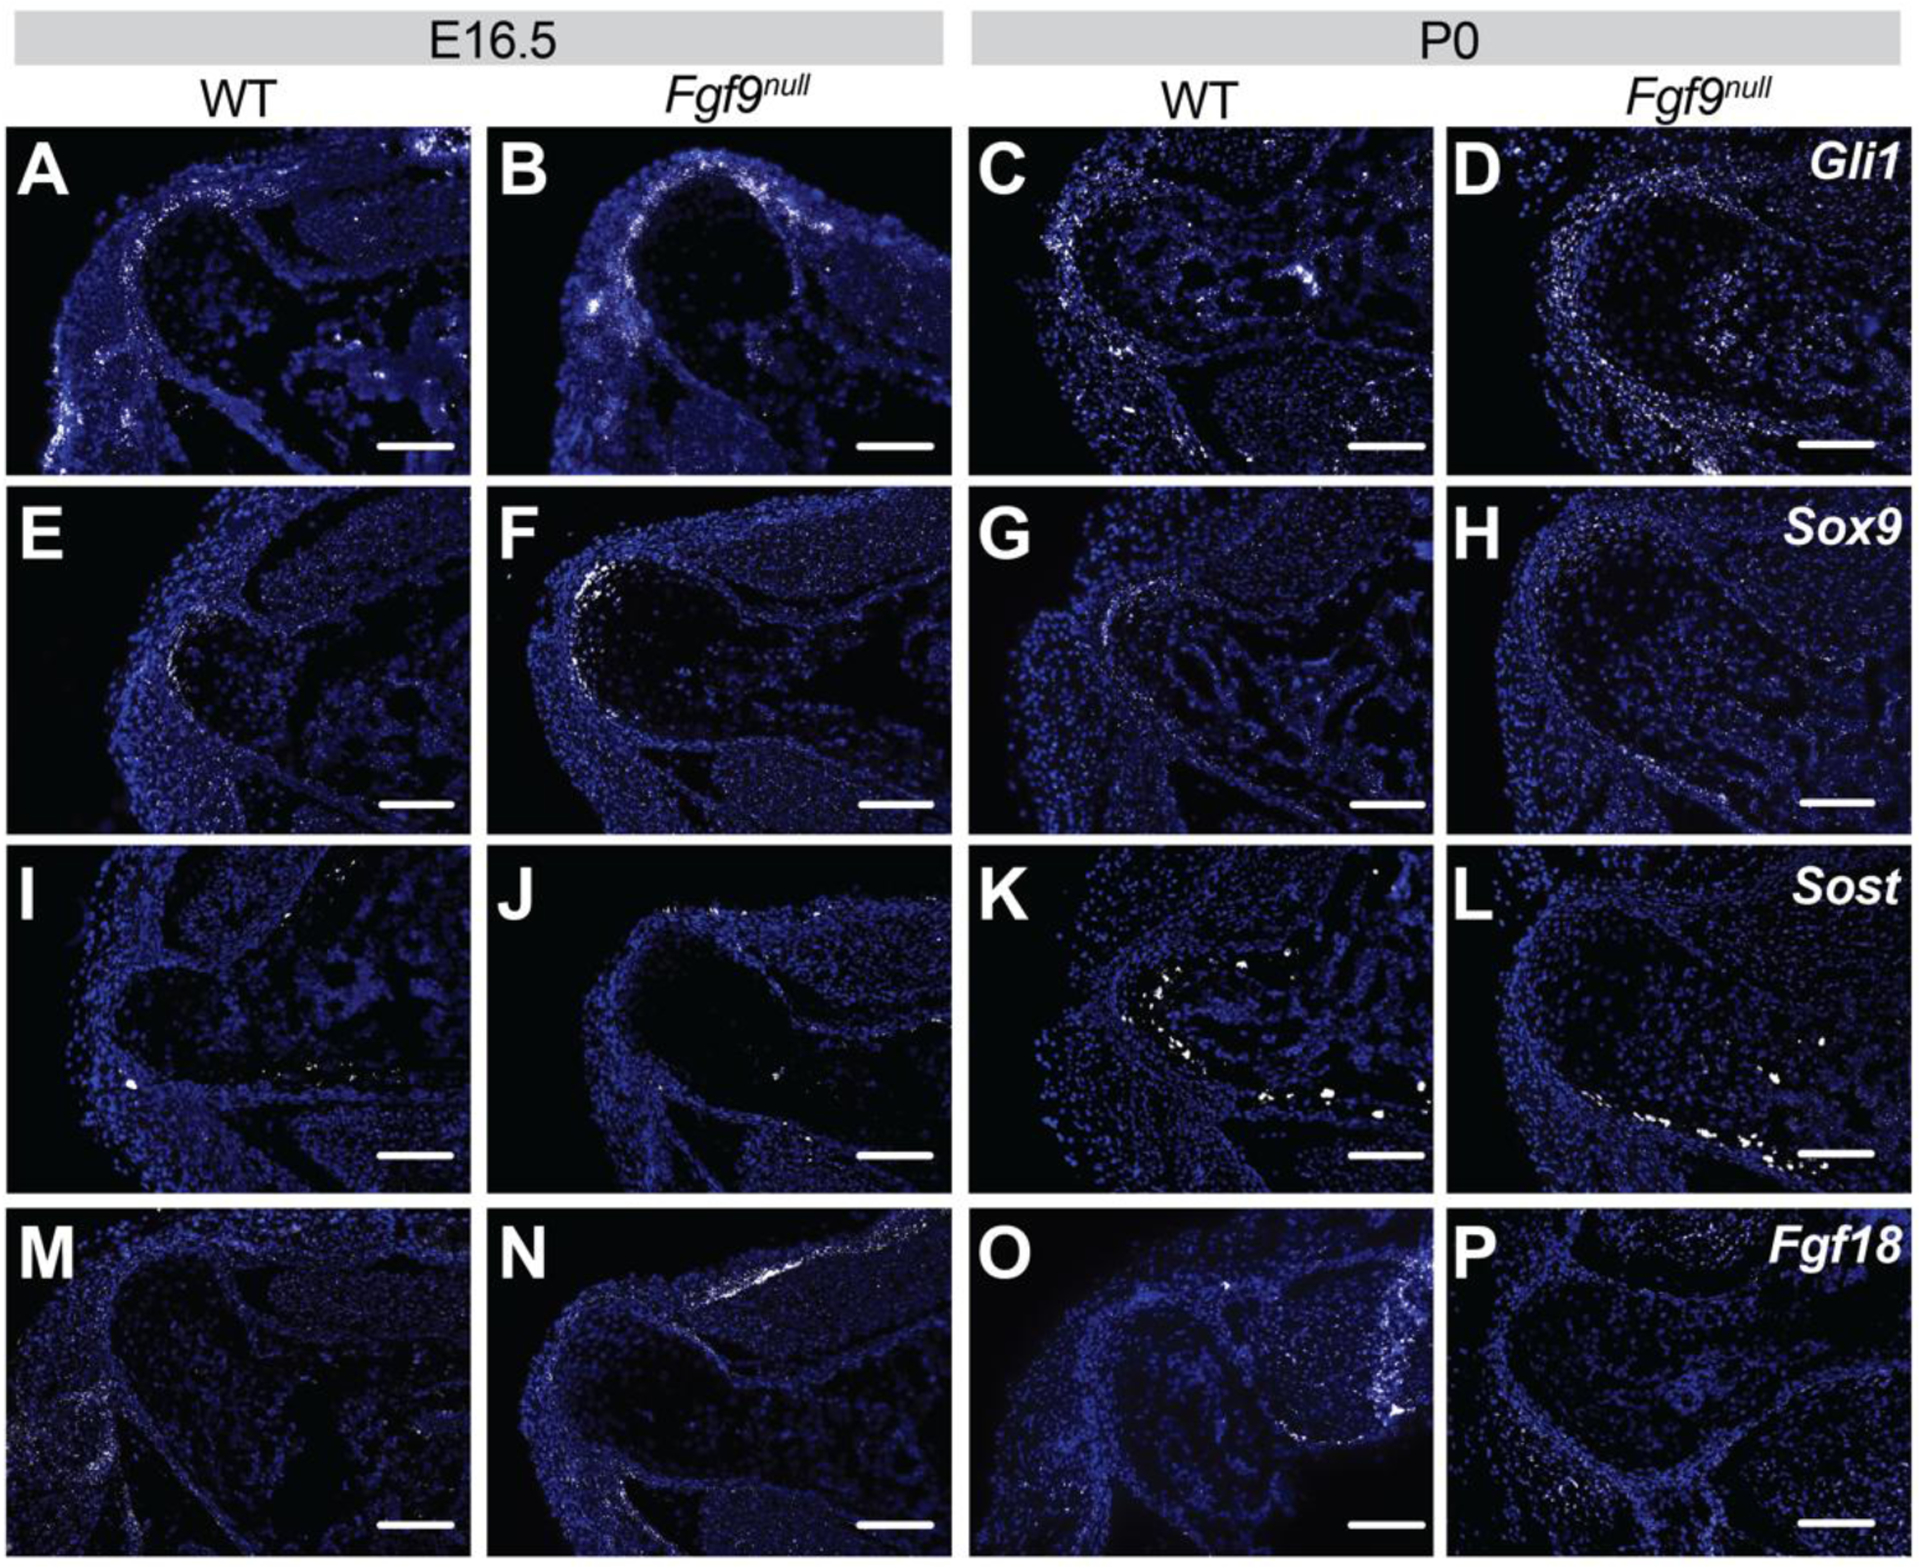
Figure 6: Fluorescent in situ hybridization (FISH) of (A-D) Gli1, (E-H) Sox9, (I-L) Sost, and (M-P) Fgf18 at E16.5 and P0 of Fgf9null and WT mice.

At E16.5, Fgf9null embryos had increased (B) Gli, (F) Sox9, and (N) Fgf18 expression compared to (A,E,I,M) WT embryos. At P0, Fgf9null neonates had less (H) Sox9 and (L) Sost, and similar (D) Gli1 and (P) Fgf18 expression compared to (C,G,L,P) WT neonates (scale bar = 100μm; n = 3 per genotype for each time point).
