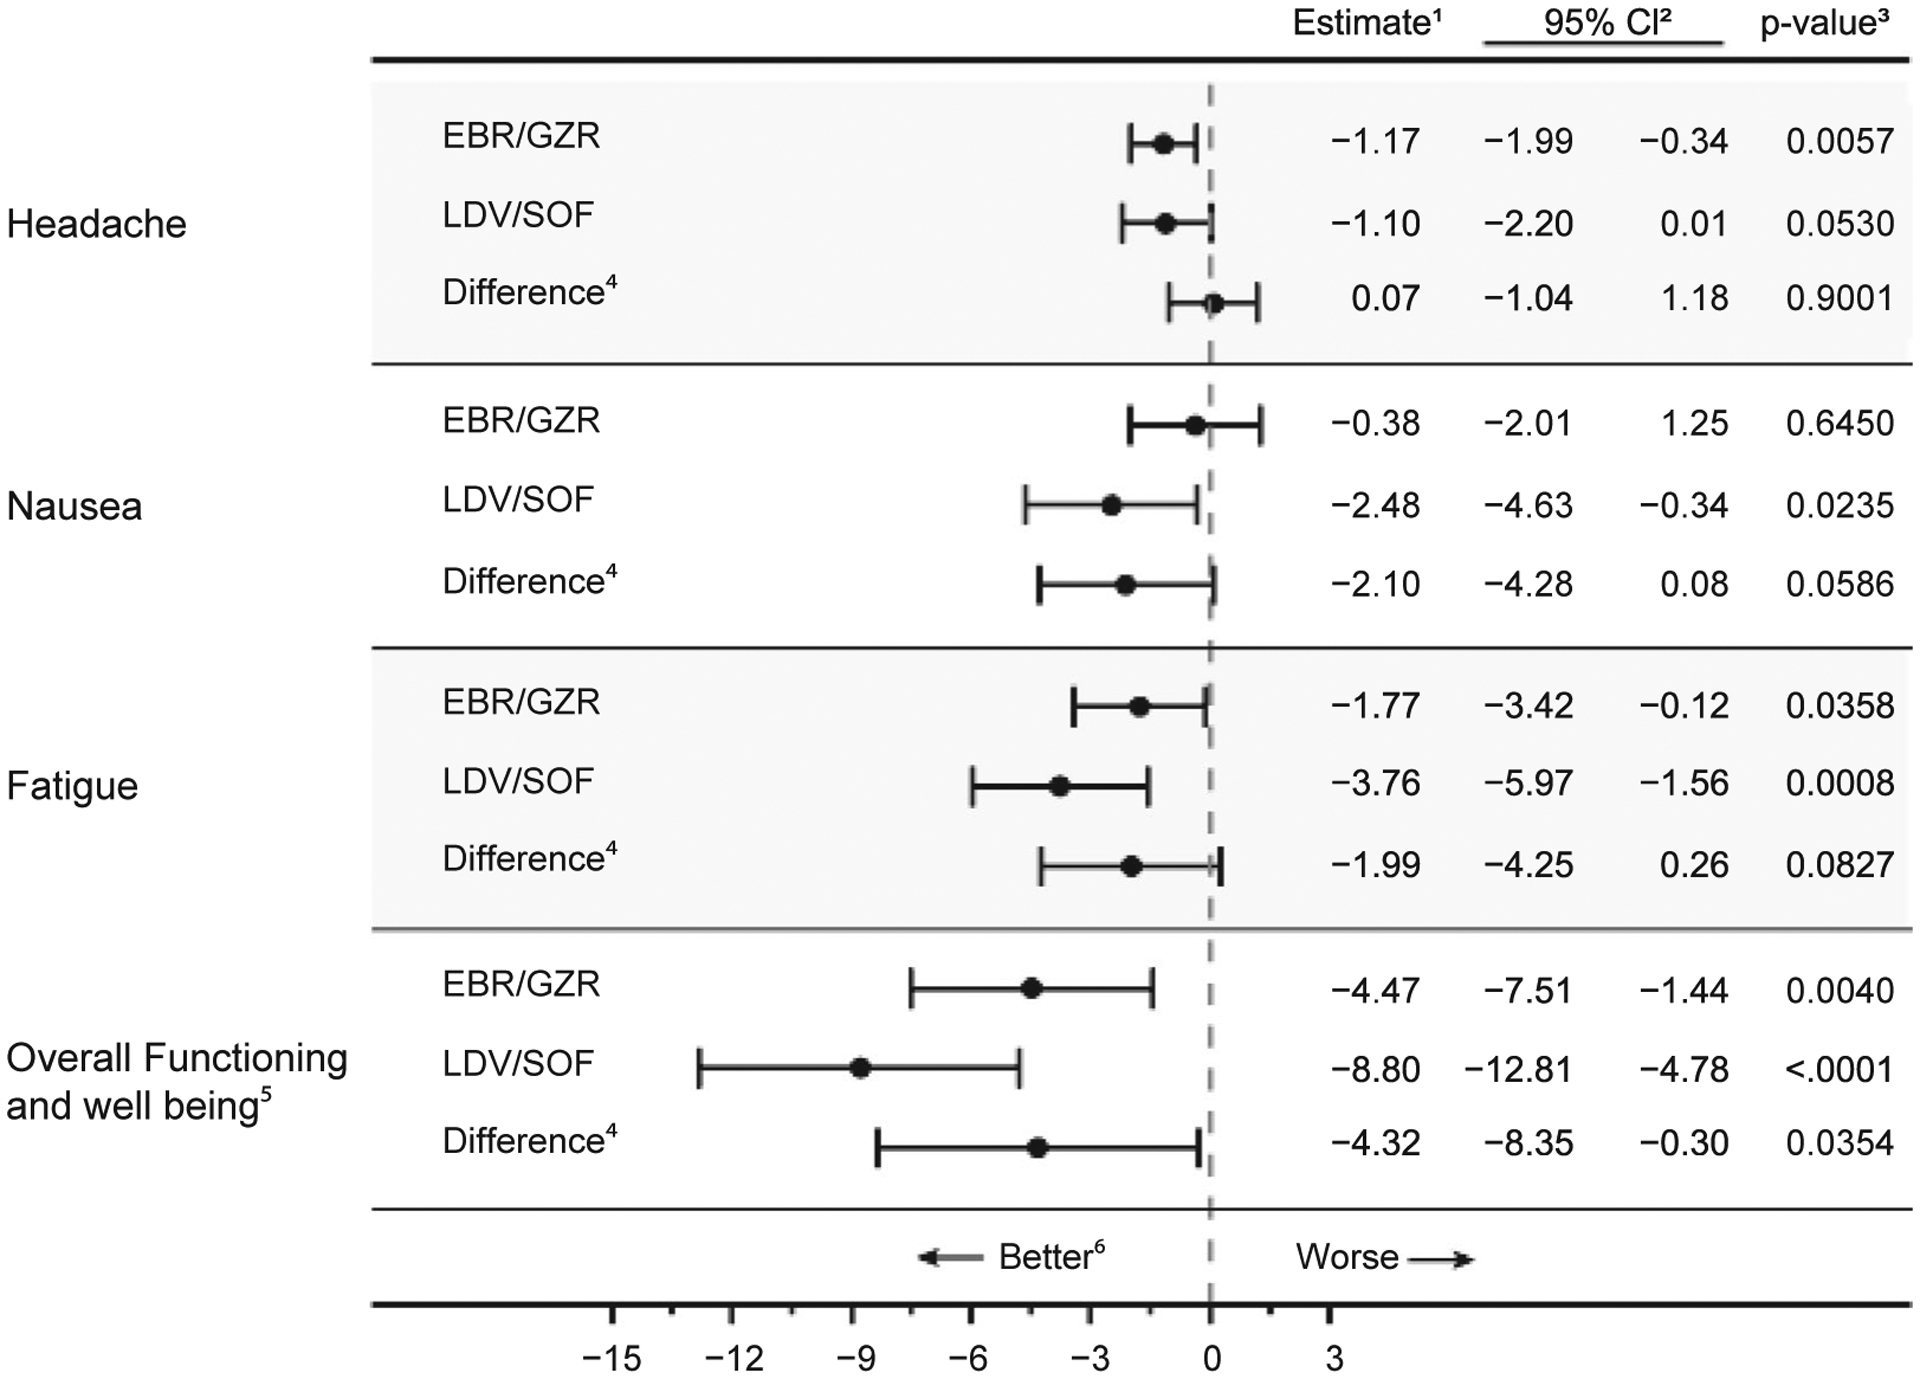
FIG. 2.

Mean change in PRO scores from baseline to on-treatment. ¹The estimates of mean change and difference were obtained from a constrained longitudinal linear mixed-effects model that treated the baseline score as one of the outcomes. The model expressed mean score as a function of DAA regimen, cirrhosis status, HCV genotype, sex, age, race, and previous treatment status. 295% confidence interval estimate. ³p-value for a test of the null hypothesis “the parameter is zero in the target population”. 4Difference of the mean change for LDV/SOF minus the mean change for EBR/GZR. 5The scale for function and well-being is reversed (= 100-HCV-PRO) for directional consistency with symptom scores. 6The scare for “Headache” is the HIT-6 score. The scare for “Nausea” is the PROMIS® Nausea Short Form T-score. The scale for “Fatigue” is the PROMIS® Fatigue Short Form T-score. Negative values for mean change represent improvement, while negative values for “Difference” indicate the LDV/SOF performed better than EBR/GZR.
