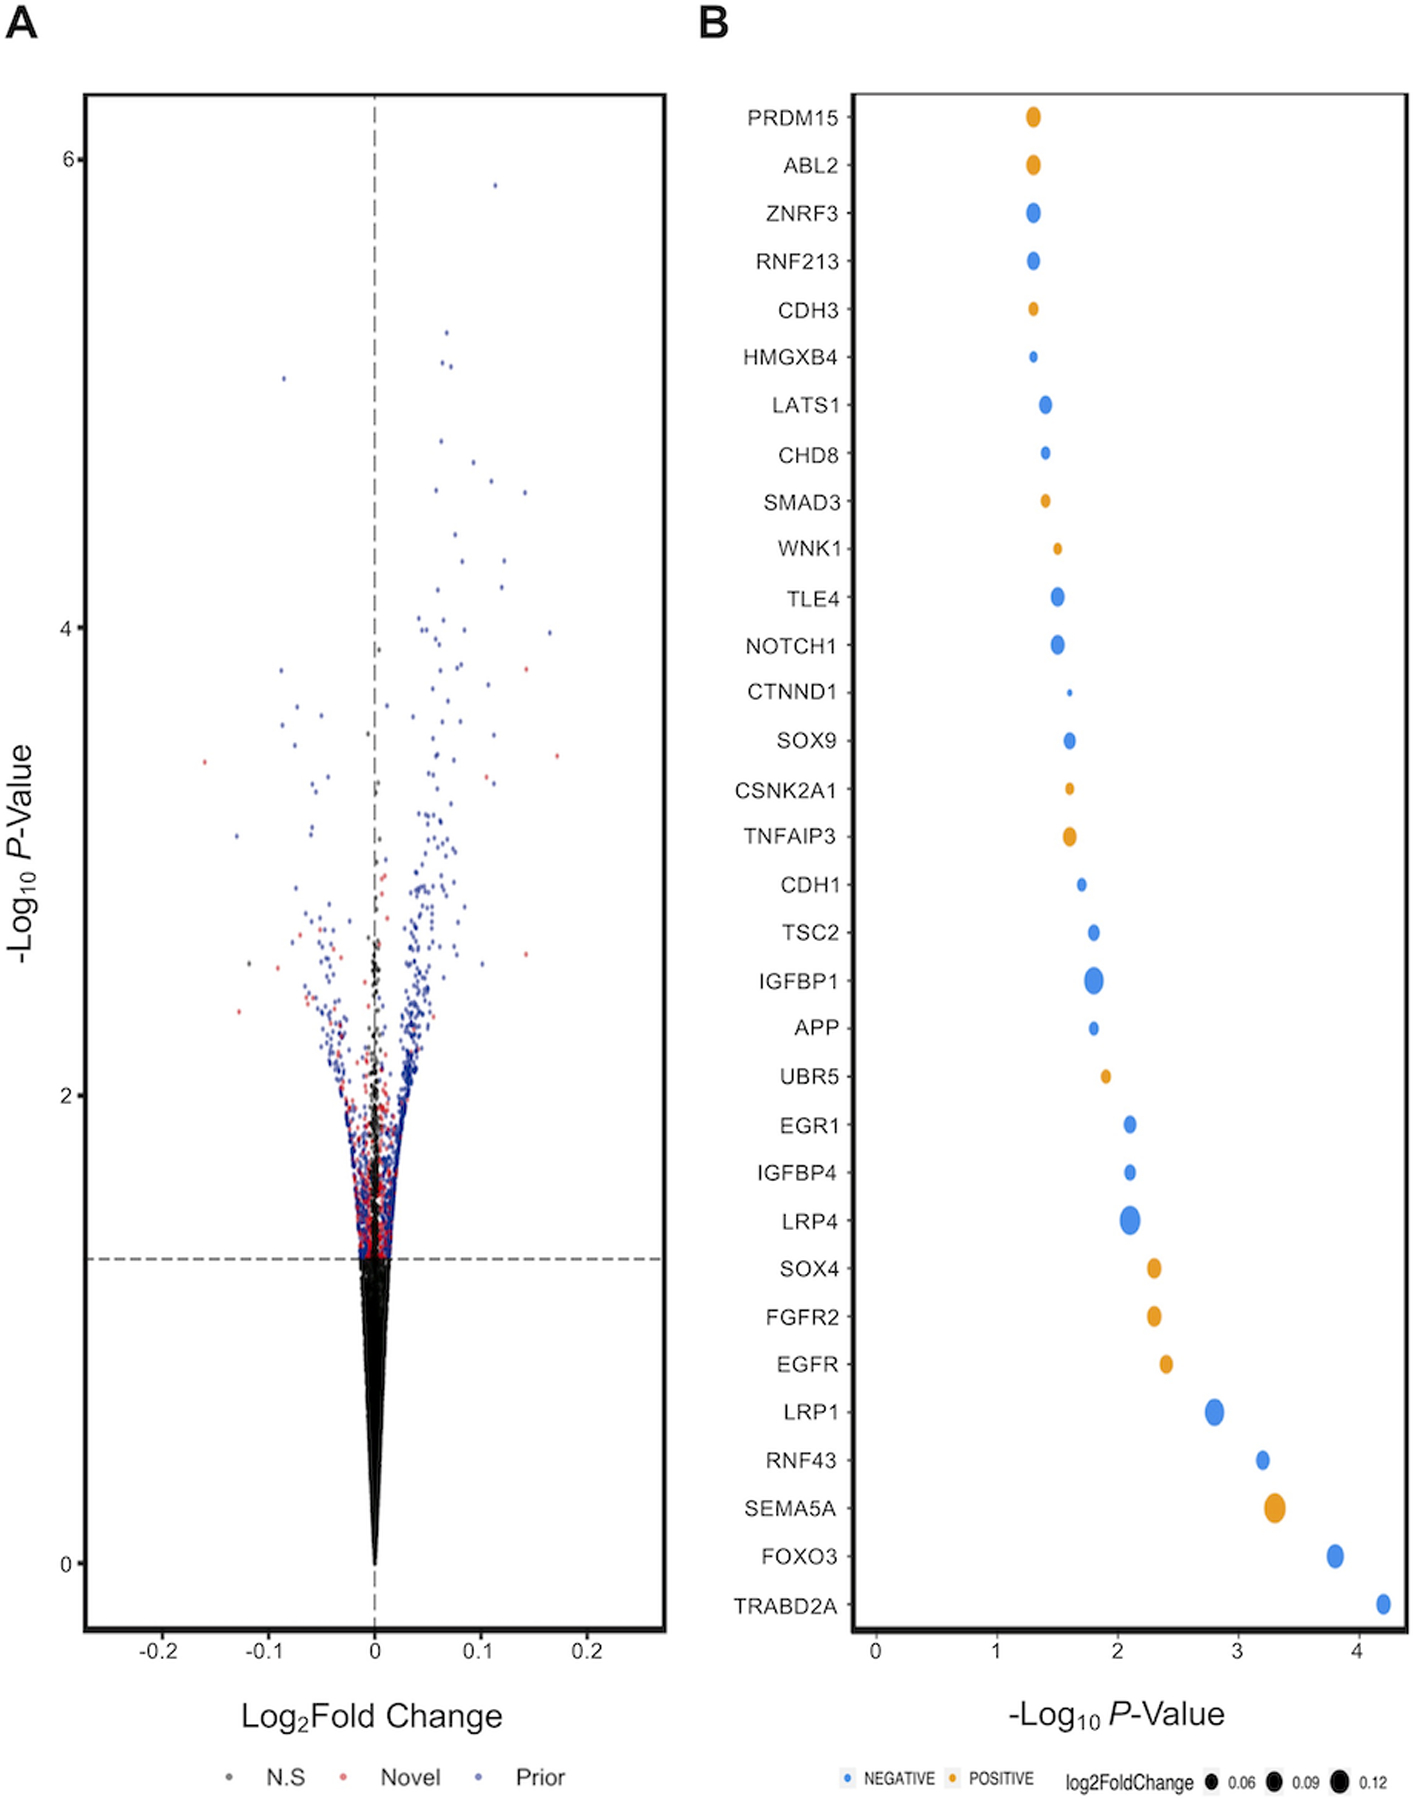
Figure 3: Differential expression analysis of aspirin-treated colon organoids following adjustment for cell composition.

A) Volcano plot of significant DEGs that were also identified in original analysis (blue) and novel (red). B) Inspection of fold change of nominal DEGs that are positively (orange) or negatively (blue) correlated with Wnt signaling, ranked from left to right in order of significance.
