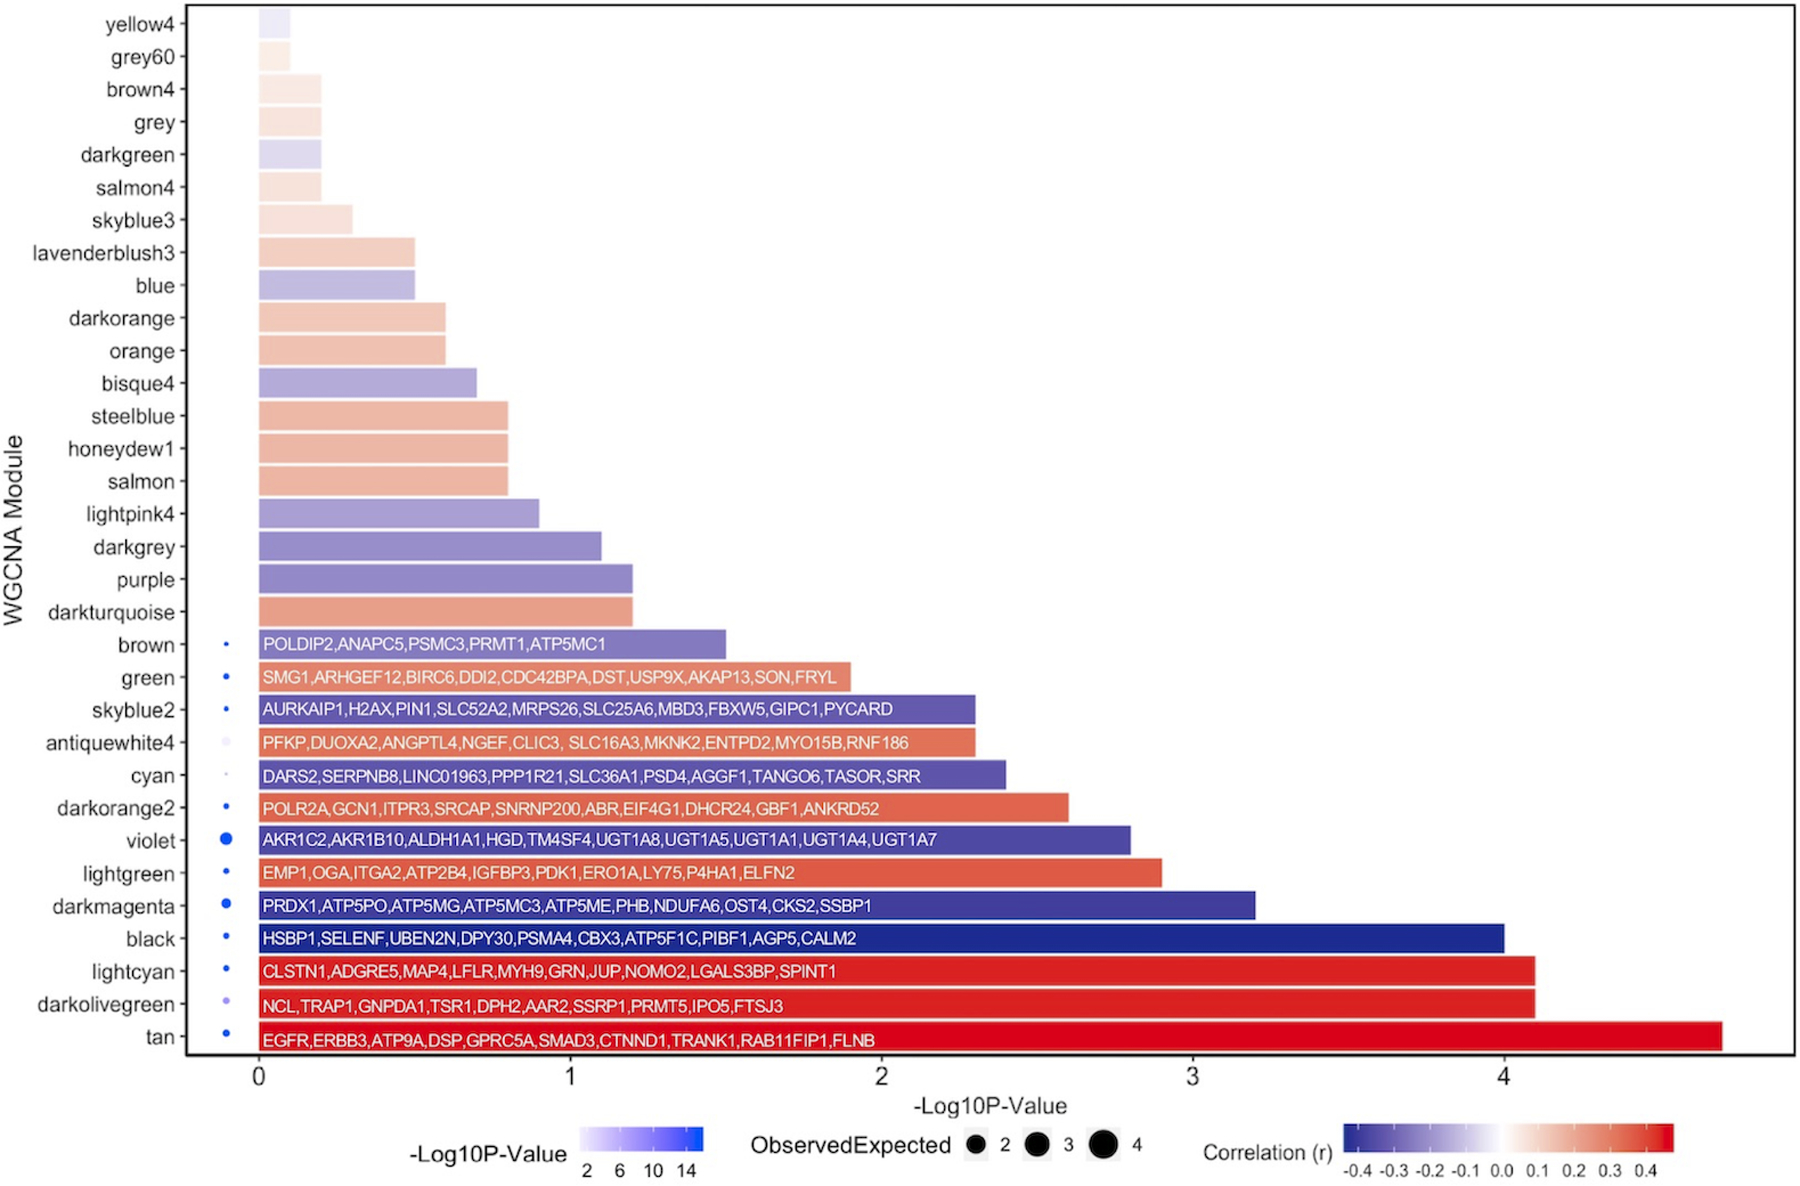
Figure 4: Bar plot to show significance of modules defined through WGCNA with relation to aspirin treatment status.

Extent of positive correlation to aspirin treatment can be visualized as deepening red hue. For each significant module, the genes with the highest module memberships were annotated. PPI enrichment analysis was performed for each significant module by uploading genes found in each module to STRING. Significance of PPI enrichment can be observed by a deepening blue hue next to the relevant module. Size of circle refers to the number generated when dividing the number of observed edges in the PPI network by the number of expected edges given the size of the network analyzed.
