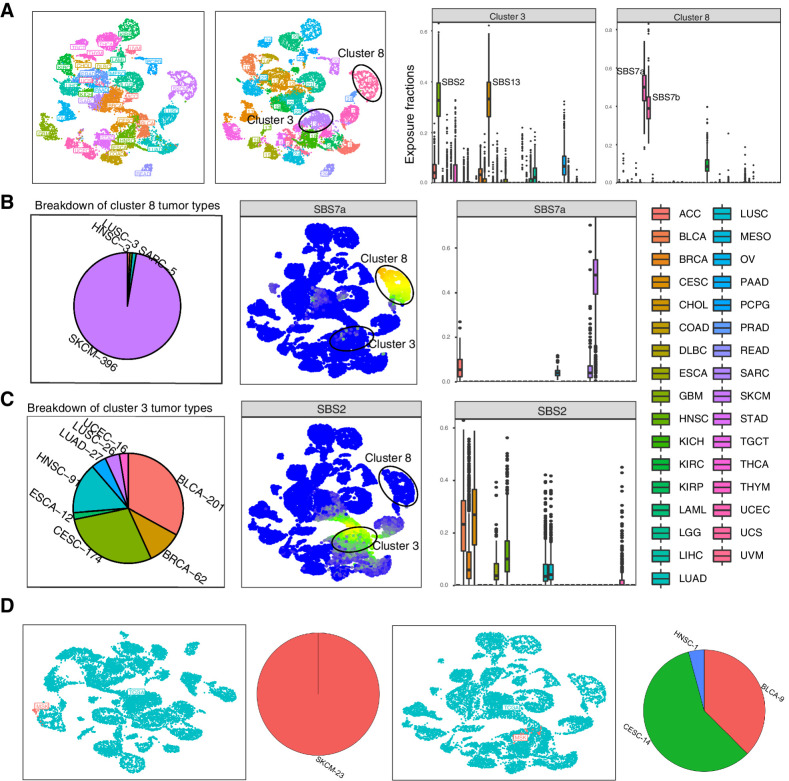
Figure 2.
Examining similarities and differences between tumor types with musicatk. Clustering of TCGA samples and inference of tumor type labels in MSK samples. A, Left to right, UMAP of TCGA samples colored by tumor types, UMAP of TCGA samples colored by cluster label, proportional exposure to COSMIC v3 signatures within cluster #3, proportional exposure to COSMIC v3 signatures within cluster #8. B, Left to right, breakdown of tumor types within cluster cluster #8, UMAP colored by exposure to SBS7a (UV), exposure of each tumor type to SBS7a. C, Left to right, breakdown of tumor types within cluster cluster #3, UMAP colored by exposure to SBS2 (APOBEC), and exposure of each tumor type to SBS2. D, Left to right, UMAP colored by cohort (TCGA, UMAP) with MSK SKCM samples, percentage of tumor types inferred for MSK SKCM samples using exposure levels from TCGA samples, UMAP colored by cohort (TCGA, UMAP) with MSK BLCA samples, percentage of tumor types inferred for MSK BLCA samples using exposure levels from TCGA samples.

