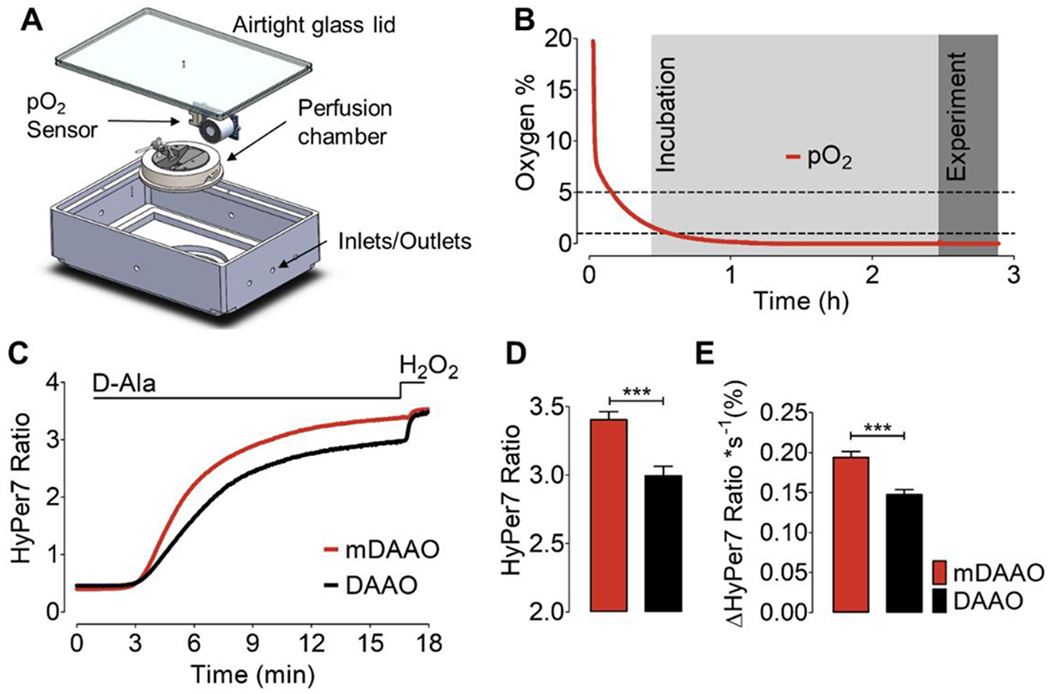
Figure 2: Hypoxia and HyPer7 responses to DAAO and mDAAO activation:

(A) This panel shows our design of a 3D-printed airtight hypoxia chamber equipped with an integrated oxygen sensor and perfusion chamber. (B) This panel shows a representative time course of pO2 levels measured in the sealed hypoxia chamber following continuous exposure to N2 gas. Light gray shows the duration of incubation of cells at ~1% pO2 for 2 hours before real-time imaging experiments. highlighted in dark grey. (C) This panel shows the HyPer7 ratio measured in HEK293 cells co-expressing the untargeted version of HyPer7 along with cytosol-targeted mCherry-mDAAO-NES or DAAO-NES in response to 10 mM D-Alanine, followed by addition of 100 μM H2O2 under hypoxic conditions. Cells were kept at ~1% O2 for 2 hours before the experiment. (D) This bar graph shows quantitative analysis of the maximum HyPer7 ratio as derived from the experiments shown in panel C. Bars show maximum HyPer7 ratio signals of HEK293 cells co-expressing either mDAAO (red bar, n=3/122) or DAAO (black bar, n=3/165) in response to 10 mM D-Alanine. (E) Bars represent kinetic analysis showing the maximum slope of HyPer7 ratio signals derived from the experiment shown in panel C. Unpaired t-test, two-tailed = p < 0.0001 P-value summary ***. All values are given as ±SEM.
