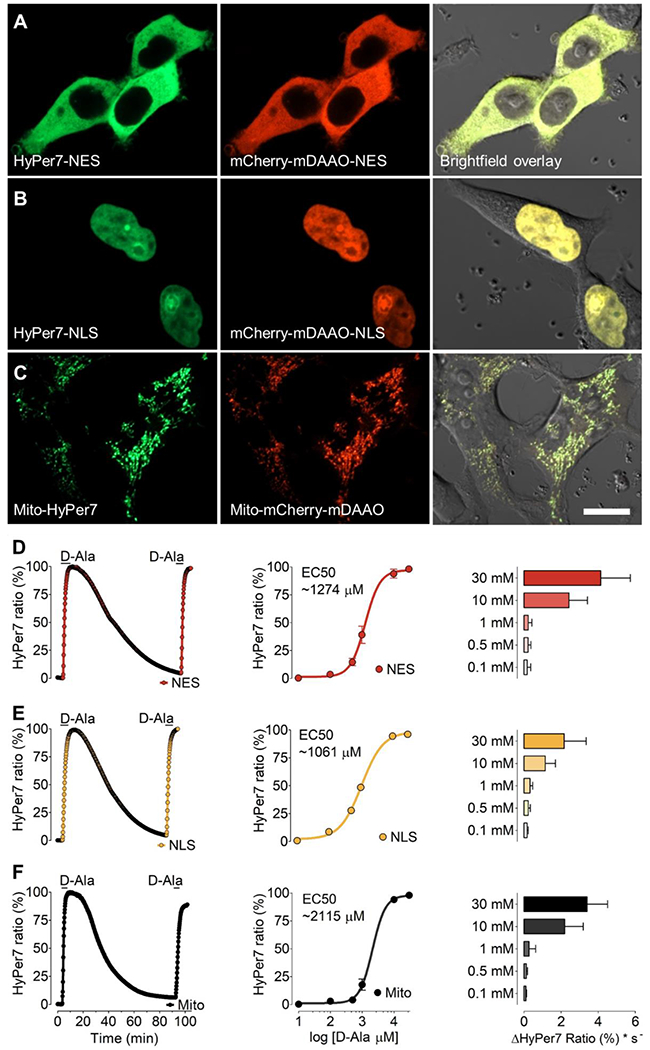
Figure 3: D-alanine dependent H2O2 generation by mDAAO targeted to subcellular locales.

Representative confocal images of HEK293 cells co-expressing HyPer7 (left panels) and mCherry-mDAAO (middle panels) are shown in the cytosol (A) nucleus (B) or mitochondria (C). Right panels show phase-contrast images overlayed with the GFP and RFP channel. Scale bar represents 20 μm. (D) The left panel shows representative real-time traces of HyPer signals in response to the addition of 10 mM D-Alanine in HEK293 cells expressing the cytosolic mCherry-mDAAO-NES and HyPer7-NES. Middle panel shows normalized changes in maximum HyPer7-NES ratio signals in response to D-Alanine concentrations as shown, including 100 μM (n=3/61), 500 μM (n=3/56), 1 mM (n=3/44), 10 mM (n=3/45) and 30 mM (n=3/54). The right panel shows the initial maximum slope of the HyPer ratio in response to different D-Alanine concentrations derived from the data shown in the middle panel. Panel (E) shows the same experimental setup as presented in panel A in HEK293 cells expressing the nuclear-targeted mCherry-mDAAO-NLS and HyPer7-NLS. Normalized concentration response curve: 100 μM (n=3/65), 500 μM (n=3/61), 1 mM (n=3/54), 10 mM (n=3/58) and 30 mM (n=3/53). Experiments in panel (F) show results in HEK293 cells expressing mitochondria-targeted Mito-mCherry-mDAAO and Mito-HyPer7. Normalized concentration response curve: 100 μM (n=3/54), 500 μM (n=3/46), 1 mM (n=3/55), 10 mM (n=3/42) and 30 mM (n=3/57).One-way ANOVA and Bonferroni’s multiple comparison post-test were applied to compare all columns with each other. Concentration-response curves were calculated using non-linear regression (log agonist vs log response) and the application of the formula: Y=Bottom + (Top-Bottom)/(1+10^((LogEC50-X))). Concentration-response curves are shown as ±SEM values and slope analysis as ±SD.
