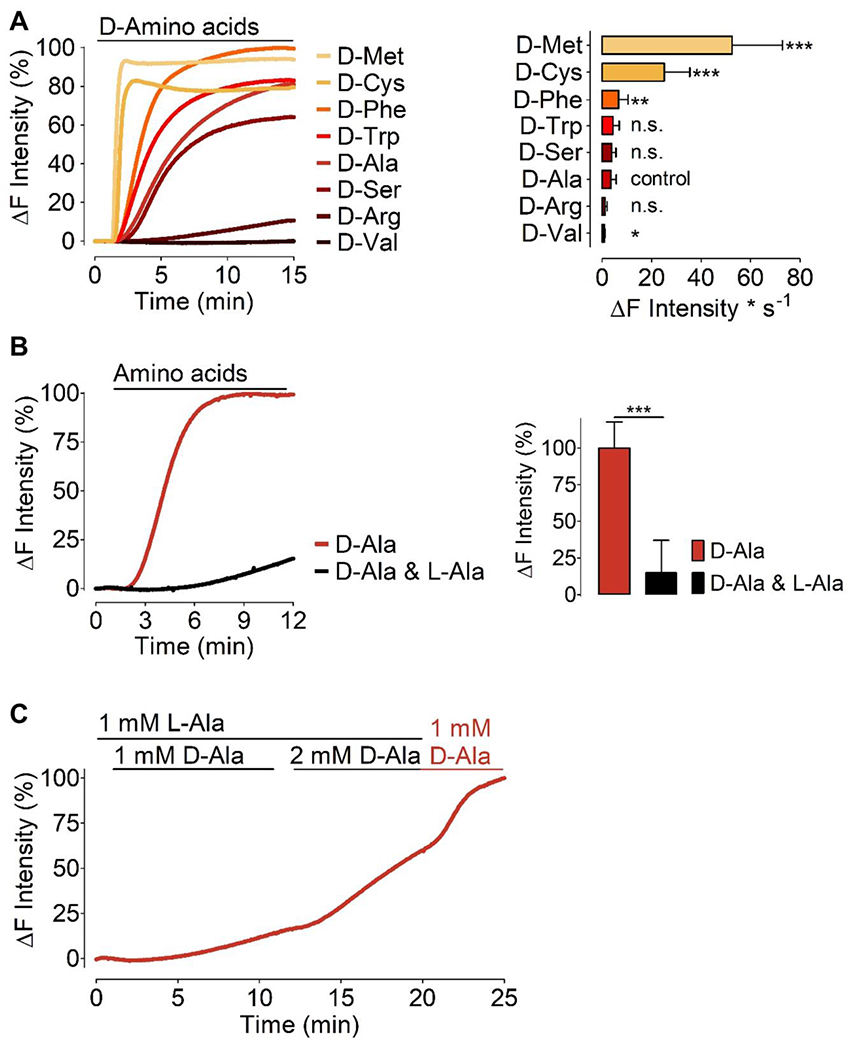
Figure 4: H2O2 generation by mDAAO in response to different D-amino acids.

(A) Left panel shows normalized average curves of HyPer7 signals in HEK293 cells expressing HyPer7-NLS and mCherry-mDAAO-NLS in response to different D-amino acids as indicated in the figure. Bars in the right panel show maximum initial slope in response to various D-amino acids (all added at 1 mM) as indicated: D-Methionine (n=3/89), D-Cysteine (n=3/71), D-Phenylalanine (n=3/89), D-Tryptophan (n=3/81), D-Serine (n=3/75), D-Alanine (n=10/254), D-Arginine (n=3/89), and D-Valine (n=3/87). D-alanine has been defined as the control group, and all D-amino acids were compared to the kinetics of D-alanine using One-way ANOVA analysis, Dunnett’s multiple comparison post-test comparison of all columns vs. control column (D-alanine) p < 0.05 P-value summary *** or ** or *. (B) Left panel shows normalized average curves of H2O2 signals in HEK293 cells co-expressing mCherry-mDAAO-NLS and HyPer7-NLS in response to 1 mM D-alanine (red curve, n=3/70) or 1 mM D-alanine and 1 mM L-alanine (black curve, n=3/68). The right panel shows statistical analysis of the experiments shown in the left panel. Unpaired t-test, two-tailed = p < 0.0001 P-value summary ***. All values are given as ±SD. (C) Average curve (n=20 cells) of real-time HyPer traces shows results obtained in HEK cells co-expressing nuclear-targeted mCherry-mDAAO-NLS and HyPer7-NLS. Cells were pre-incubated in 1 mM L-Alanine for 1 hour prior to imaging and during imaging experiments consecutively provided with L-Ala or D-Ala at the concentrations indicated in the figure.
