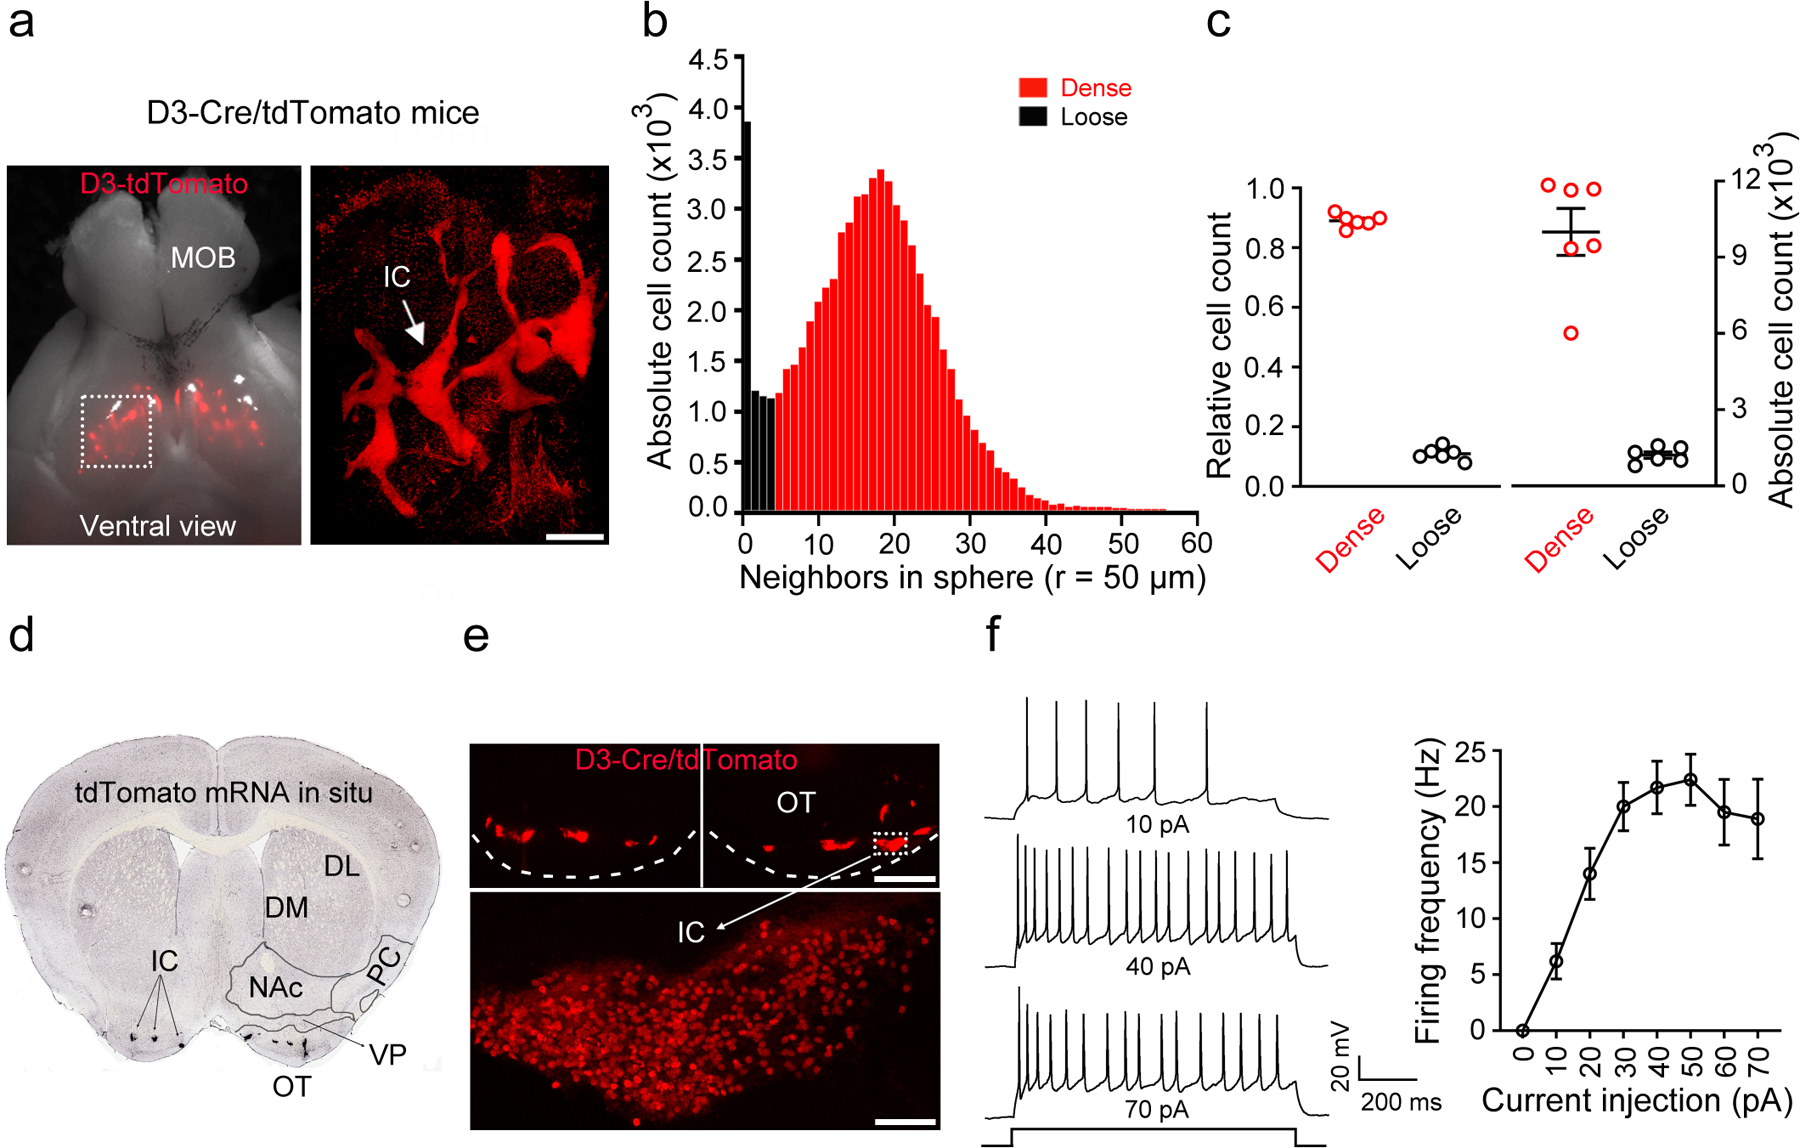
Figure 1. The Islands of Calleja (IC) contain densely-packed granule cells expressing the D3 dopamine receptor.

a, Ventral view of the brain from a D3-Cre/tdTomato mouse. Right, an enlarged image of the OT (dotted rectangle in left panel) after the brain was made transparent via CLARITY. Similar results were obtained from 6 OTs of 3 mice. MOB, main olfactory bulb. OT, olfactory tubercle. Scale bar = 500 μm. b, Histogram depicting the number of neighboring D3 neurons within the vicinity of a given cell (50 μm sphere radius). Two populations of neurons (dense versus loose) emerge with a cut-off of 5 neighboring cells. c, Relative and absolute numbers of dense versus loose D3 neurons. Data were from 6 OTs of 3 mice for b,c. d, A coronal section across the ventral striatum showing in situ hybridization against tdTomato mRNA in a D3-Cre/tdTomato mouse (image from Allen Mouse Brain Connectivity Atlas: http://connectivity.brain-map.org/transgenic/experiment/304168043)60. DL/DM, dorsolateral/dorsomedial striatum. NAc, nucleus accumbens. PC, piriform cortex. VP, ventral pallidum. OT, olfactory tubercle. e, D3-Cre/tdTomato neurons visualized as clusters (IC) in the OT (upper) and in a single island (lower) (similar observations in 10 mice used in f). Scale bars = 100 μm (upper) and 50 μm (lower). f, Left, firing of an IC D3-Cre/tdTomato neuron upon varied current injections. Right, average firing frequencies versus injected currents (n = 10 neurons selected from 10 mice). Holding potential = −60 mV. All averaged data are shown as mean ± SEM.
