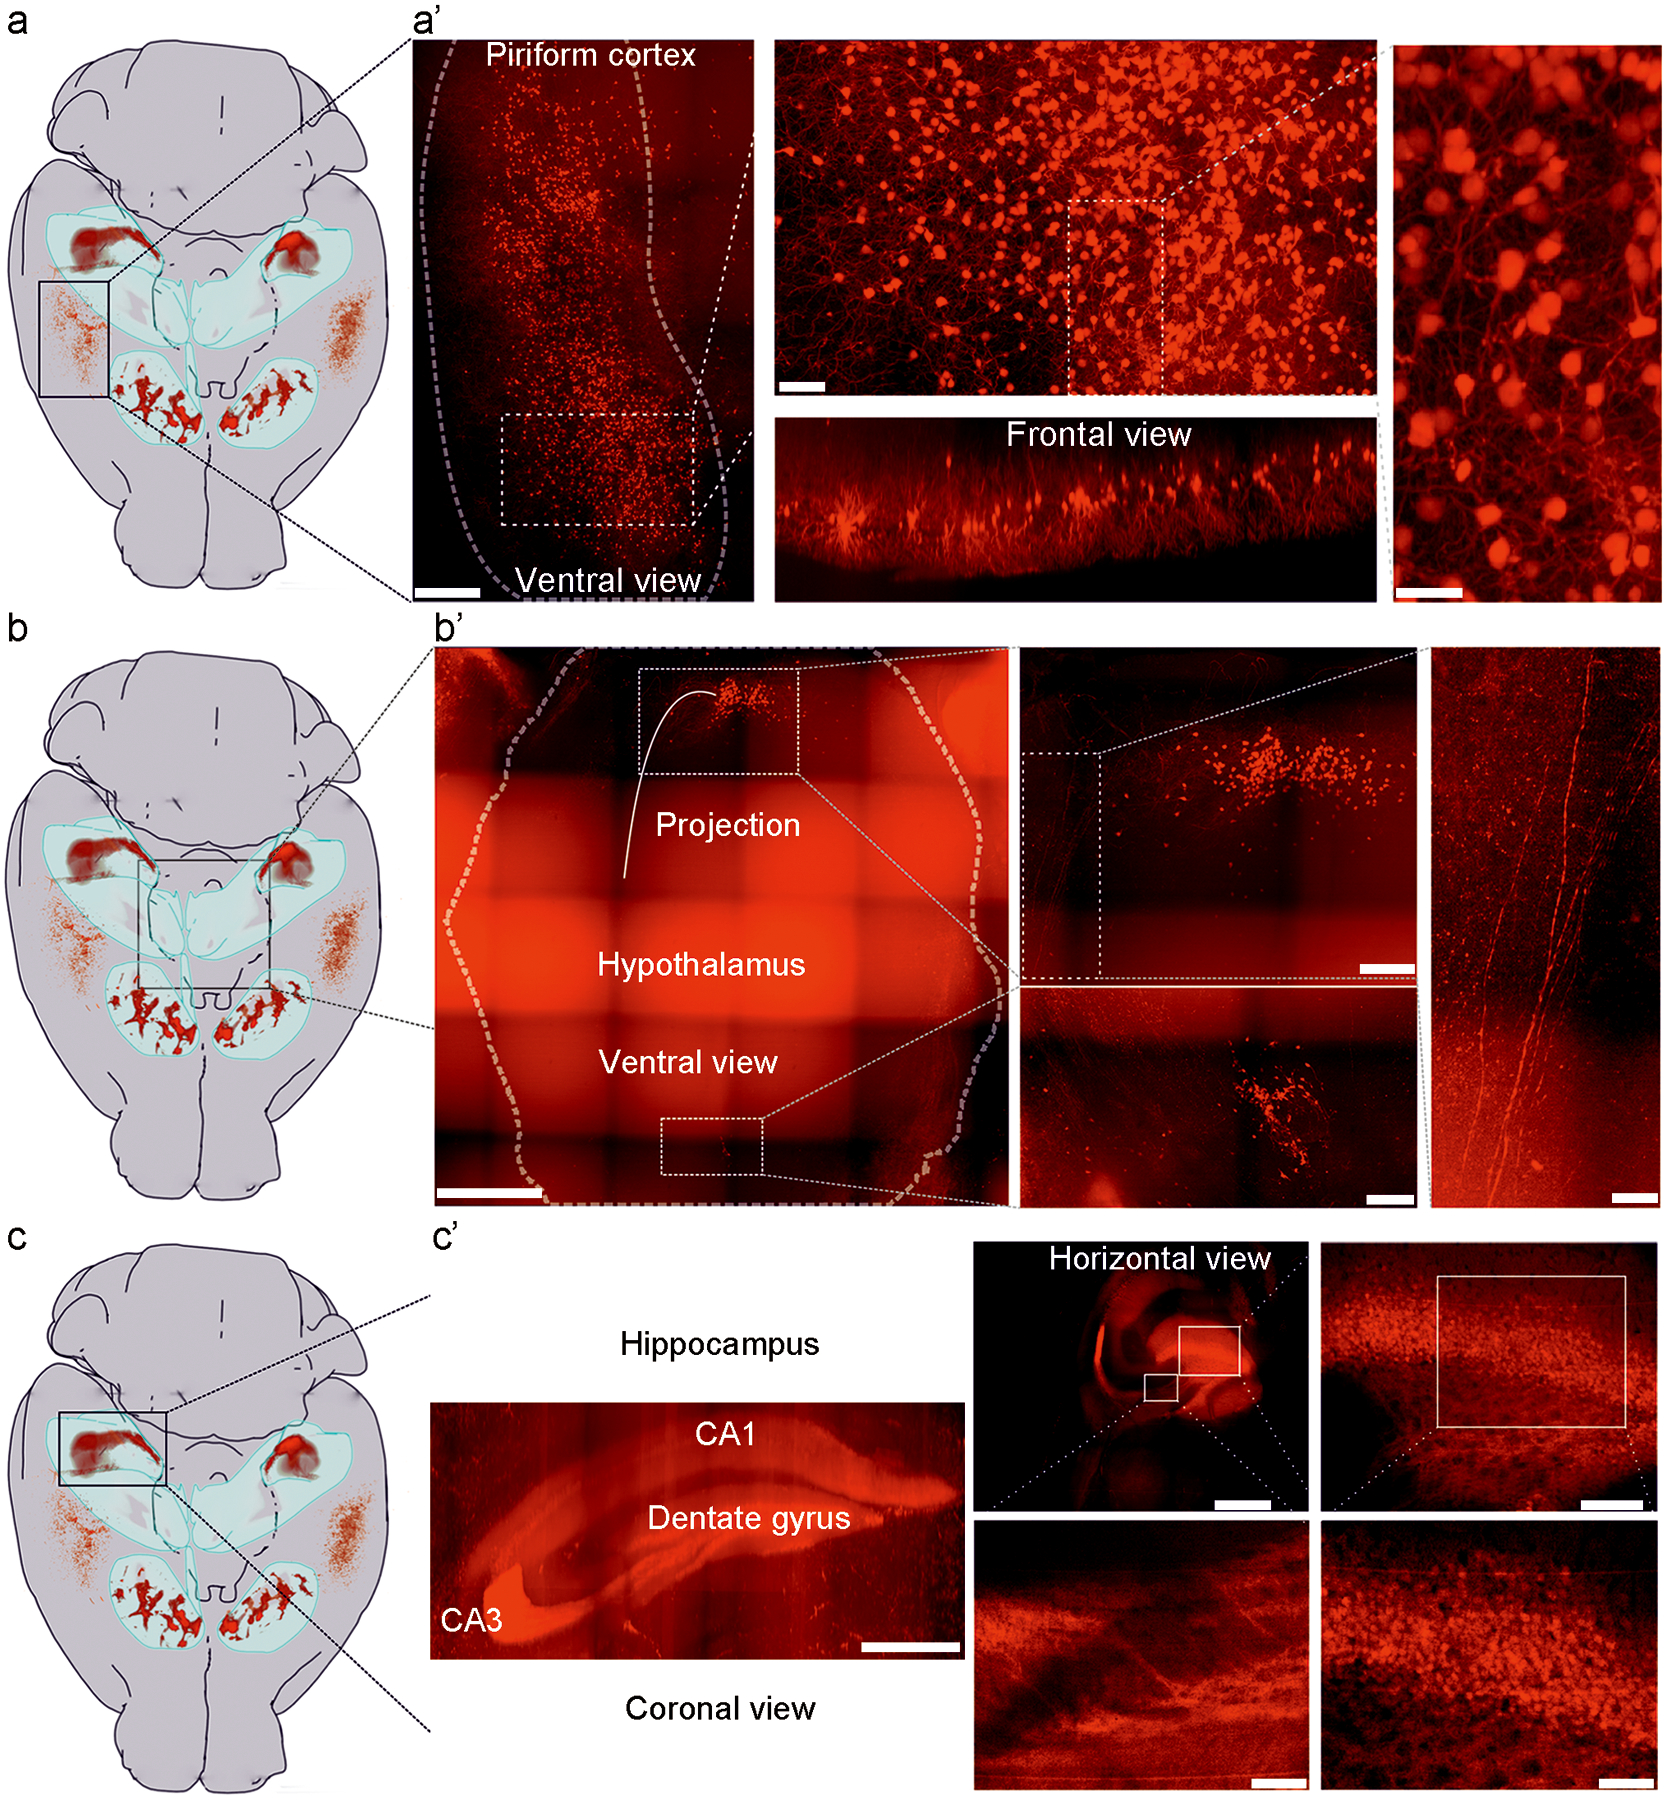
Extended Data Fig. 3. D3-Cre/tdTomato neurons in the piriform cortex, the hypothalamus and the hippocampus.

Location(s) of D3 neurons within the mouse brain are mapped onto a sample-adjusted version of the Allen Mouse Brain Atlas. The OT and hippocampal formation (HF) are outlined as light blue volumes. a, D3 neurons in the piriform cortex do not project to targets outside this region. a’, 3D projection of the piriform cortex region outlined in a (black rectangle). Different areas are shown at higher magnification. Note that no projection fibers are evident; in frontal view, D3 neurons appear to adhere to a layer-specific organization. Scale bars = 500 μm (left), 200 μm (middle), and 100 μm (right). b, Two areas in the hypothalamus harbor D3 neurons. Of these, neurons in the caudal aspect of the hypothalamus exhibit some projections. b’, 3D maximum projection of the hypothalamic region outlined in b (black rectangle). Different areas are shown at higher magnification. Relatively sparse, but consistent tdTomato expression is observed at both a relatively caudal and rostral region within the hypothalamus (close to midline). Note that few fibers are evident at the caudal site, whereas no fibers are found at the rostral site. Scale bars = 1000 μm (left), 300 μm (middle), and 100 μm (right). c, D3 neurons in the hippocampus. c’, 3D projection of the hippocampal region outlined in c (black rectangle). Different areas are shown at higher magnification. Scale bars = 1000 μm (left), 1000 μm (middle, upper panel), 100 μm (middle, lower panel), 200 μm (right, upper panel) and 100 μm (right, lower panel). Similar results were observed in 3 mice for a-c.
