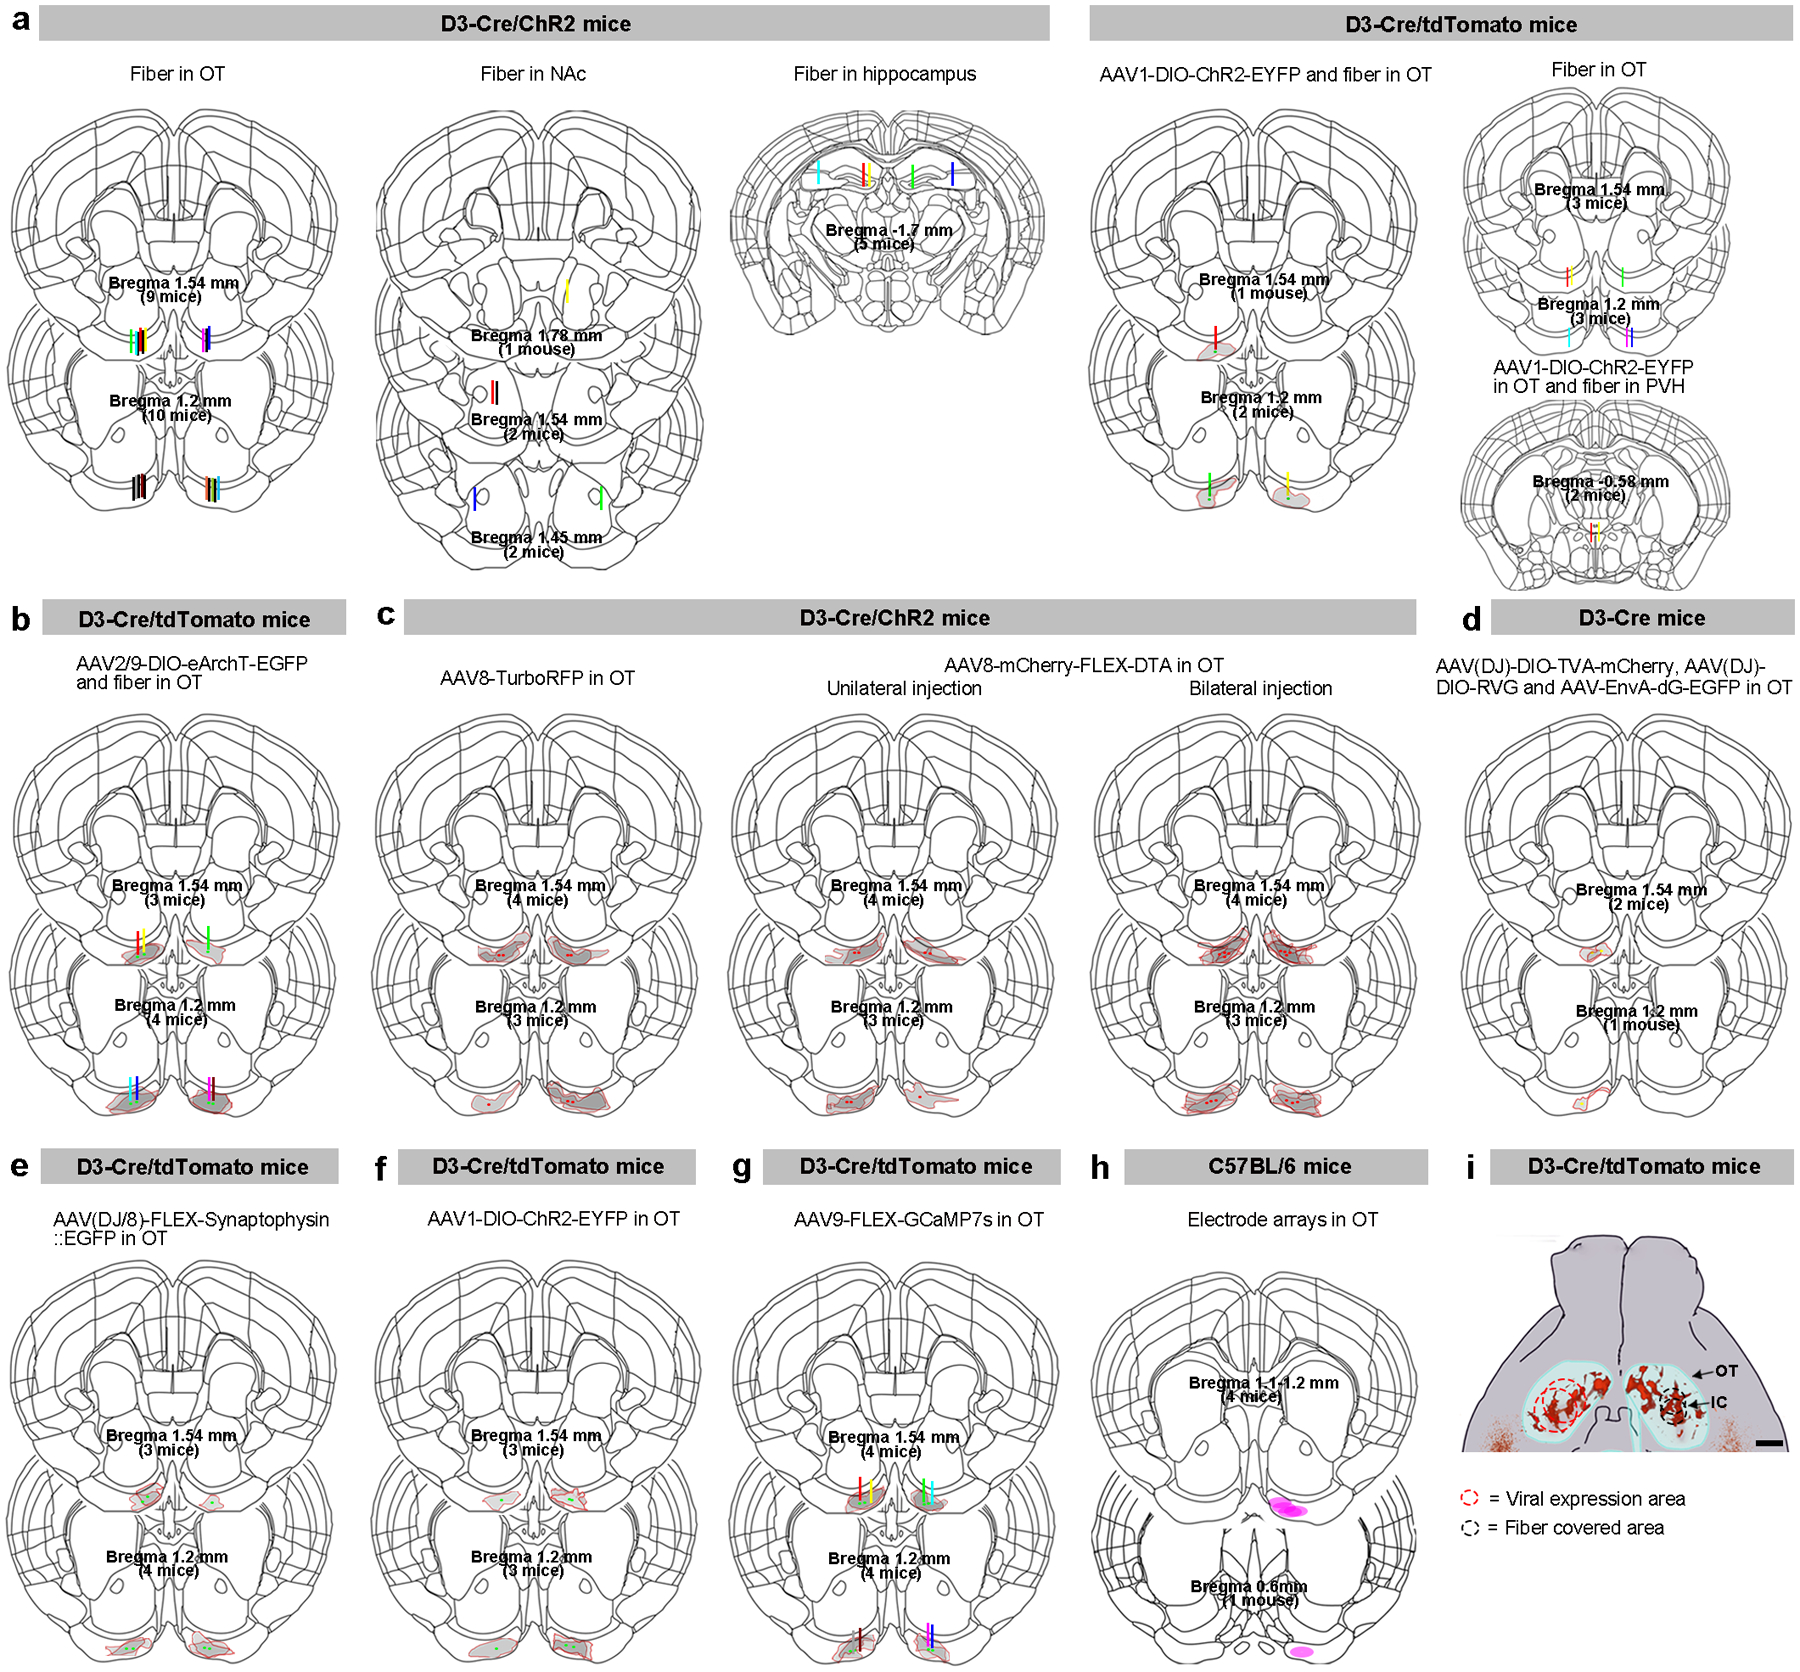
Extended Data Fig. 5. Viral injection/expression sites and optical fiber placements for experiments in Figs. 2–8.

Coronal brain sections at the bregma levels showing viral injection sites (dots)/expression areas (gray shadow areas with red borders) and/or optical fiber tracts (vertical bars) for mice included. a-b, Optogenetic experiments (Figs. 2, 3 in a and Fig. 4 in b). c, DTA ablation experiments (Fig. 5). d-e, Retrograde (Fig. 6 in d) and anterograde (Fig. 7 in e) tracing experiments. f, Electrophysiological recordings (Fig. 7 in f), and (g) fiber photometry experiments (Fig. 8). For clarity, an optical fiber (400 μm) is shown as a thin vertical bar at the center of the tract. h, Electrode array locations from in vivo unit recording experiments (Fig. 8). i, Schematic showing viral expression and fiber covered areas for the two coordinates used in the OT. Scale bar = 500 μm. Each dot or line represents one animal except for bilateral AAV8-DTA injection in c. Brain atlas images are modified from Allen Mouse Brain Common Coordinate Framework version 3 (https://scalablebrainatlas.incf.org/mouse/ABA_v3). IC, islands of Calleja. OT, olfactory tubercle. NAc, nucleus accumbens. PVH, paraventricular hypothalamic nucleus.
