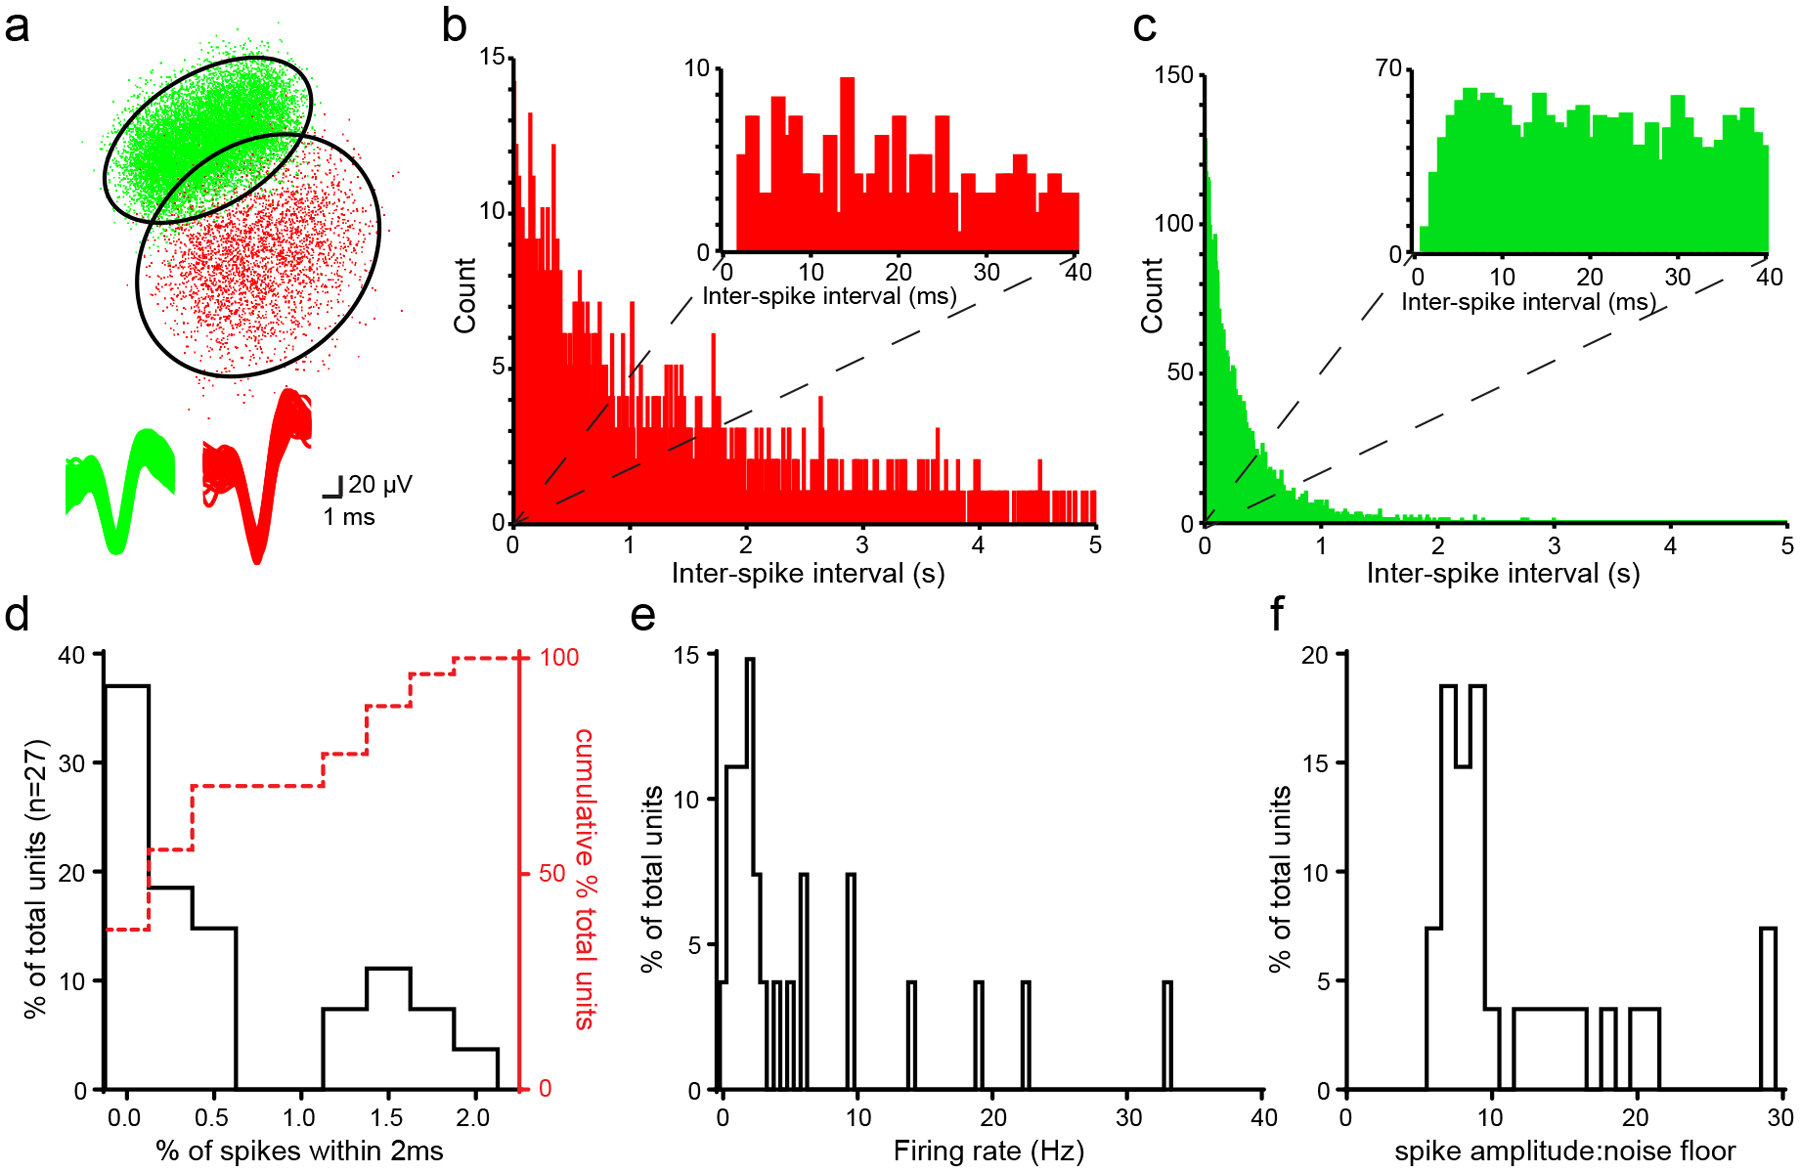
Extended Data Fig. 7. Single unit quality control metrics.

a, Upper panel, PCA plot of two putative single units recorded from the same electrode. Ellipses denote 2.5x SD of each K-means cluster. Lower panel, overlaid waveforms of the same neurons. b-c, Inter-spike intervals (ISIs, 2 ms bins) for the same two neurons as in (a) indicating significantly different distributions (two-sample Kolmogorov-Smirnov test D (2493) = 0.22, p <0.0001). Insets, ISI distributions (1 ms bins) showing limited numbers (< 2%) of ISI events < 2ms. d, Distribution of the proportion of ISI violations (< 2ms between spikes) among all single units. 100% of units had <2% of their spikes occurring within 2ms of each other. e, Distribution of mean firing rates during entire recording session of all single units (median: 1.97 Hz, typical of spiny projection neurons). f, Distribution of spike amplitude: noise floor values for all single units.
