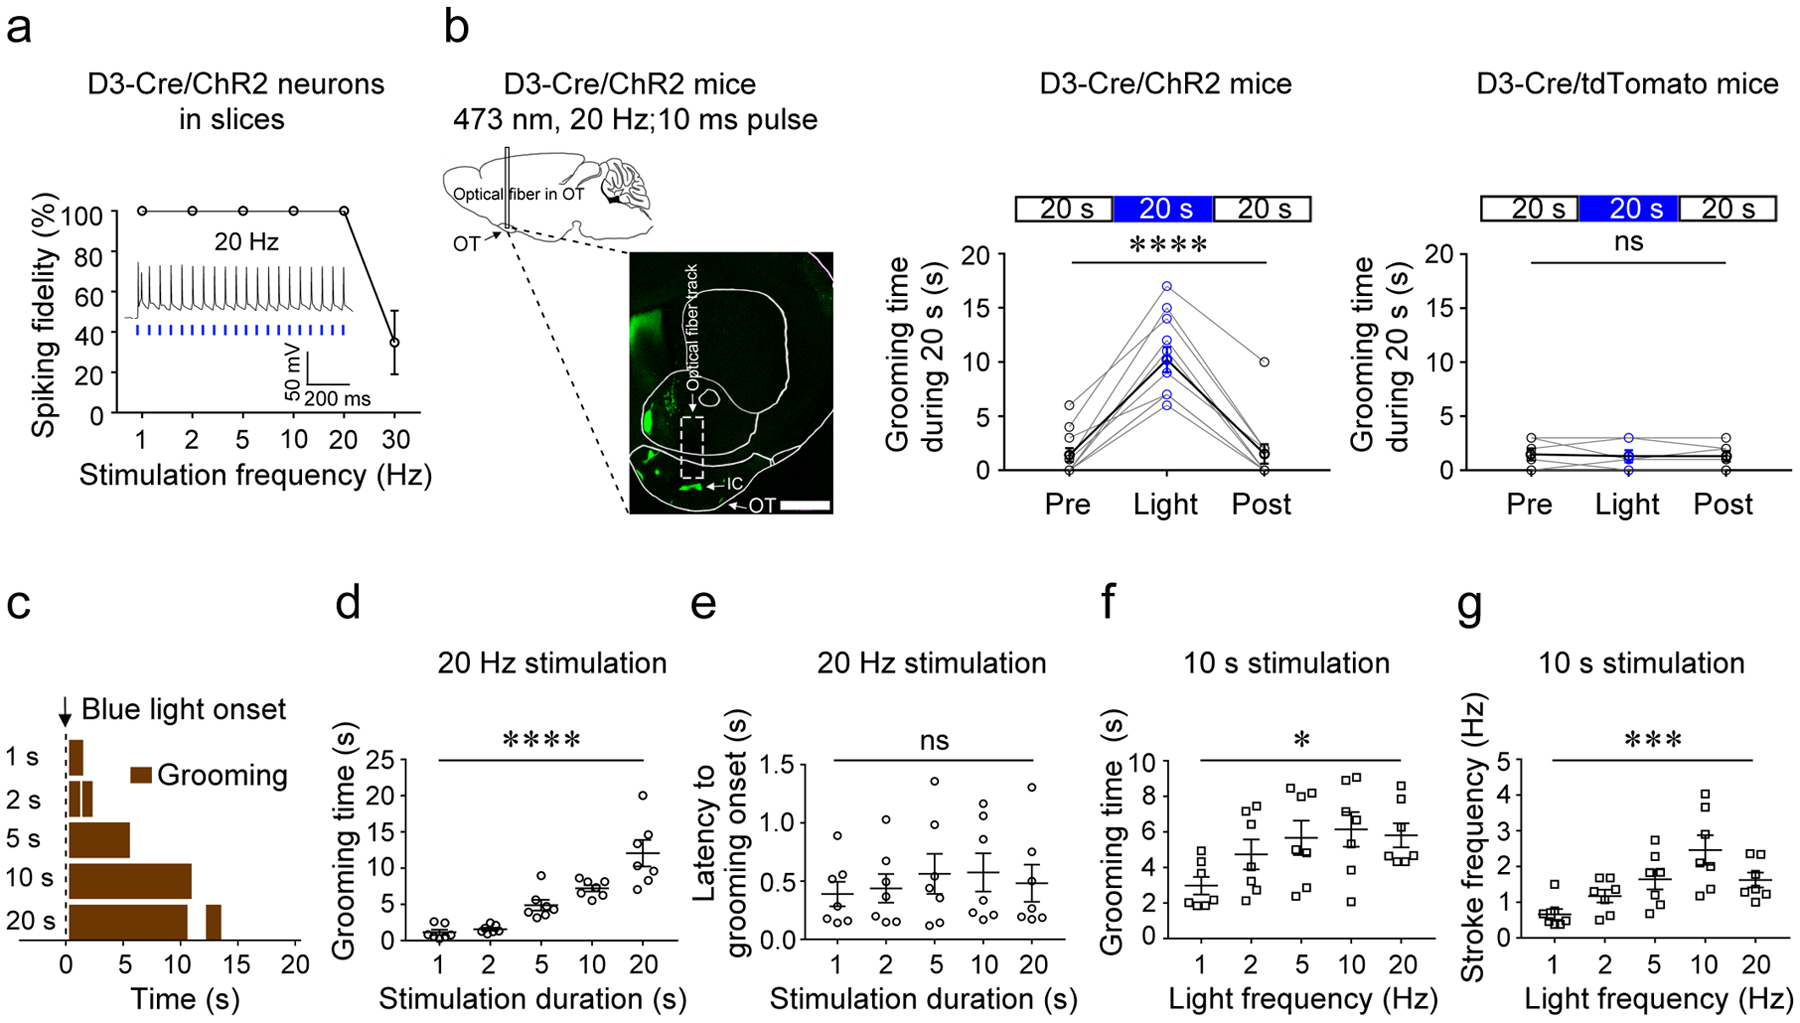
Figure 2. Activation of OT D3-Cre/ChR2 neurons induces grooming.

a, Spiking fidelity of IC D3-Cre/ChR2 neurons (n = 5 from 3 mice) upon blue light stimulation at different frequencies. The inset shows firing of an IC D3-Cre/ChR2 neuron upon laser stimulation at 20 Hz. b, Left, schematic of the optogenetic stimulation strategy and a representative image (coronal section) showing the optical fiber near the IC in the OT. Scale bar = 1 mm. Middle, the total grooming time in 20 s before, during, and after blue light stimulation in D3-Cre/ChR2 mice (n = 11; 3 trials/mouse; Friedman test, p = 1.69E-5). Right, the total grooming time in 20 s before, during, and after blue light stimulation in D3-Cre/tdTomato control mice (n = 6; 3 trials/mouse; Friedman test, p = 1.000). OT, olfactory tubercle. IC, islands of Calleja. c, Grooming behavior induced by light stimulation of varying lengths from a single mouse. d, The total time of grooming (within 20 s from the light onset) induced by varying stimulation durations (n = 7; F (4, 30) = 46.54; p = 1.90E-12). e, Latency from light onset to grooming onset (n = 7; F (4, 30) = 0.21; p = 0.933). f, The total time of grooming (within 10 s from the light onset) induced by varying stimulation frequencies (n = 7; F (4, 30) = 2.85; p = 0.0410). g, The stroke frequency of grooming induced by varying stimulation frequencies (n = 7; F (4, 30) = 6.45; p = 0.0007). Aligned Rank Transformation one-way ANOVA was used in (d)-(g). Each data point is an average of five trials from a single animal for d-g. *p < 0.05, ***p < 0.001, ****p < 0.0001, and ns, not significant. All averaged data are shown as mean ± SEM.
