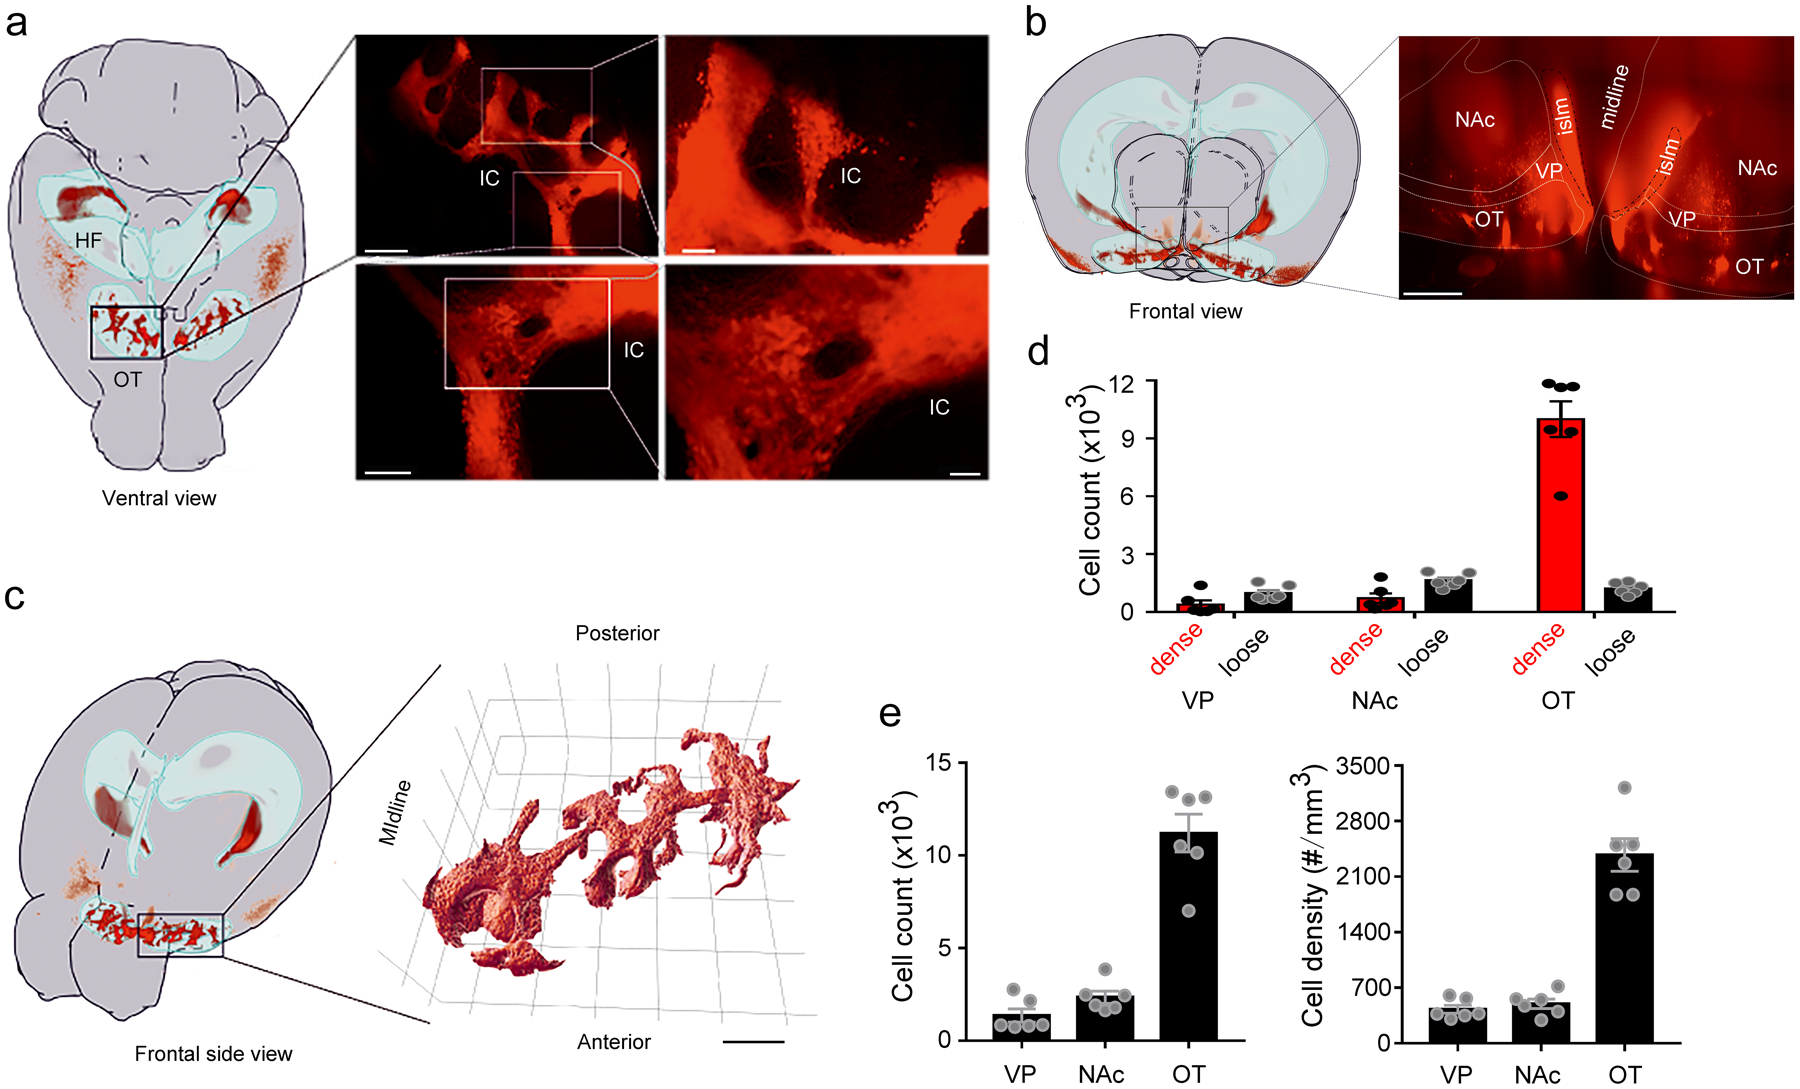
Extended Data Fig. 1. Quantification of D3-Cre/tdTomato neurons in the ventral striatum.

a, Left, ventral view of location(s) of D3-Cre/tdTomato neurons within a mouse brain mapped onto a sample-adjusted version of the Allen Mouse Brain Atlas. The OT and hippocampus are outlined as light blue volumes. Right, 3D projection of the OT region outlined (black rectangle). Scale bars = 400 μm (upper left), 100 μm (upper right), 150 μm (lower left), and 50 μm (lower right). b, Left, frontal view projection of the location(s) of D3-Cre/tdTomato neurons. Right, 3D projection of the ventral striatum. Scale bar = 300 μm. c, Left, frontal side view projection of the location(s) of D3-Cre/tdTomato neurons. Right, 3D surface rendering of the IC network. Scale bar = 500 μm. d-e, Quantification of D3 neurons in the ventral striatum and ventral pallidum. Absolute numbers of dense versus loose neurons in d, total numbers of neurons in e (left) and cell density in e (right) in the VP, the NAc and the OT. n = 6 hemispheres from 3 mice. All averaged data are shown as mean ± SEM. OT, olfactory tubercle. HF, hippocampal formation. IC, islands of Calleja. islm, major island. VP, ventral pallidum. NAc, nucleus accumbens.
